
FIGURE
Fig. S3
- ID
- ZDB-FIG-180517-10
- Publication
- Eimon et al., 2018 - Brain activity patterns in high-throughput electrophysiology screen predict both drug efficacies and side effects
- Other Figures
- All Figure Page
- Back to All Figure Page
Fig. S3
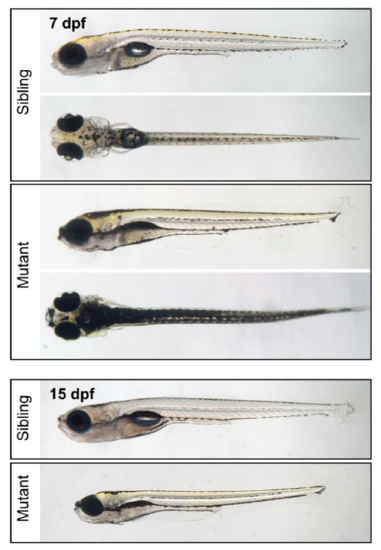
Visible phenotypes in the scn1labsa16474 line. (Top) Lateral and dorsal views of an sa16474 homozygous mutant and an age-matched sibling control larva at 7 dpf. Mutant larvae exhibit dark coloration due to dispersed melanosomes and fail to inflate their swim bladders. (Bottom) Lateral view of an sa16474 homozygous mutant and an age-matched sibling control larva shown at the same magnification at 15 dpf. Mutants fail to thrive and show elevated levels of mortality beginning in the second week of development (survival of mutants at 14 dpf=32%, n=28; survival of siblings at 14 dpf=95%, n=39). |
Expression Data
Expression Detail
Antibody Labeling
Phenotype Data
| Fish: | |
|---|---|
| Observed In: | |
| Stage Range: | Days 7-13 to Days 14-20 |
Phenotype Detail
Acknowledgments
This image is the copyrighted work of the attributed author or publisher, and
ZFIN has permission only to display this image to its users.
Additional permissions should be obtained from the applicable author or publisher of the image.
Full text @ Nat. Commun.