
Fig. 7
- ID
- ZDB-FIG-180427-16
- Publication
- Hosono et al., 2017 - Oncogenic Role of THOR, a Conserved Cancer/Testis Long Non-coding RNA
- Other Figures
- All Figure Page
- Back to All Figure Page
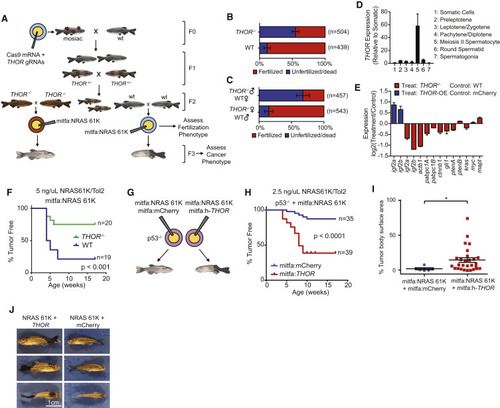
THOR Regulates Melanoma Onset in Zebrafish (A) Schematic depicting creation of THOR-knockout zebrafish model. (B) Fraction of fertilized zebrafish embryos derived from wild-type or THOR-knockout zebrafish (−/−) 6 hr following mating. ∗ indicates p ≤ 0.01 by a χ2 test. Data show mean ± SD from two independent experiments. (C) Fraction of fertilized 6-hpf zebrafish embryos derived from wild-type female crossed with THOR-knockout male or THOR-knockout female crossed with wild-type male. ∗ indicates p ≤ 0.01 by a χ2 test. Data show mean ± SD from two independent experiments. (D) Expression levels of z-THOR in testicular somatic cells as well as in 6 Hoechst-profiled subpopulations of testicular germ cells. Data show mean ± SD. (E) Bar plot demonstrates expression of 12 zebrafish orthologs of the canonical IGF2BP1 target genes by qRT-PCR in zebrafish embryos. Expression represented as log2 of the fold change of either THOR−/− compared to wild-type embryos (red) or THOR overexpression compared to control mCherry. Data show mean ± SD from one of the two independent experiments. (F) Kaplan-Meier curve of melanoma free period for mitfa promoter driven NRAS 61K zebrafish in either THOR−/− background or wild-type background. p values were determined using a log-rank test. (G) Schematic describing the generation of the h-THOR-overexpression melanoma zebrafish model. (H) Kaplan-Meier curve of melanoma-free period for p53−/− zebrafish co-injected with either mitfa promoter driven NRAS 61K + mitfa promoter driven human THOR or mitfa promoter driven NRAS 61K + mCherry. p values were determined using a log rank test. (I) Percentage of body area covered in melanoma for mCherry and h-THOR injected zebrafish also containing mitfa-promoter-driven NRAS 61K. ∗ indicates p ≤ 0.01 obtained by a two-tailed Student’s t test. (J) Specimen example of NRAS 61K driven melanomas in zebrafish co-injected with mitfa-promoter-driven h-THOR or mitfa-promoter-driven mCherry in a p53−/− background. Data show mean ± SE for all panels with error bars. See also Figure S7. |
| Gene: | |
|---|---|
| Fish: | |
| Anatomical Term: | |
| Stage: | Adult |
| Fish: | |
|---|---|
| Observed In: | |
| Stage: | Shield |
Reprinted from Cell, 171, Hosono, Y., Niknafs, Y.S., Prensner, J.R., Iyer, M.K., Dhanasekaran, S.M., Mehra, R., Pitchiaya, S., Tien, J., Escara-Wilke, J., Poliakov, A., Chu, S.C., Saleh, S., Sankar, K., Su, F., Guo, S., Qiao, Y., Freier, S.M., Bui, H.H., Cao, X., Malik, R., Johnson, T.M., Beer, D.G., Feng, F.Y., Zhou, W., Chinnaiyan, A.M., Oncogenic Role of THOR, a Conserved Cancer/Testis Long Non-coding RNA, 1559-1572.e20, Copyright (2017) with permission from Elsevier. Full text @ Cell