
Fig. 7
- ID
- ZDB-IMAGE-180427-16
- Genes
- Publication
- Hosono et al., 2017 - Oncogenic Role of THOR, a Conserved Cancer/Testis Long Non-coding RNA
- All Figures
- Figures for Hosono et al., 2017
|
Fig. 7
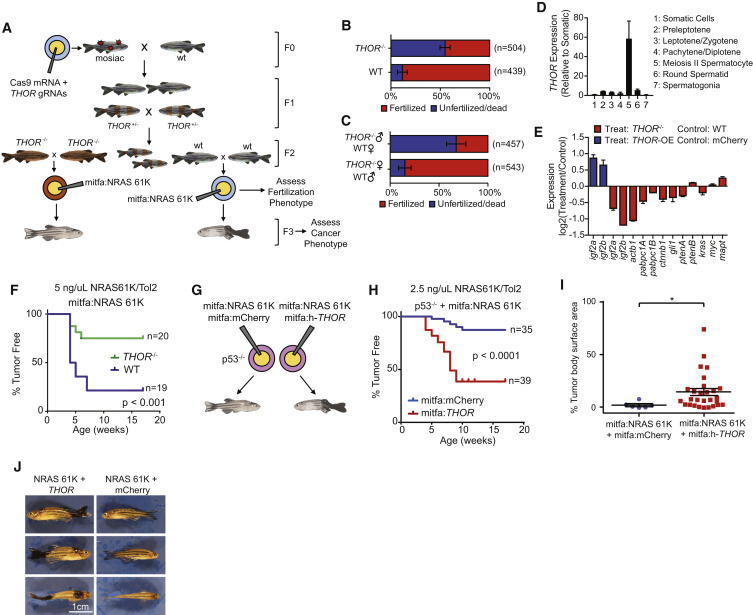
THOR Regulates Melanoma Onset in Zebrafish
(A) Schematic depicting creation of THOR-knockout zebrafish model.
(B) Fraction of fertilized zebrafish embryos derived from wild-type or THOR-knockout zebrafish (−/−) 6 hr following mating. ∗ indicates p ≤ 0.01 by a χ2 test. Data show mean ± SD from two independent experiments.
(C) Fraction of fertilized 6-hpf zebrafish embryos derived from wild-type female crossed with THOR-knockout male or THOR-knockout female crossed with wild-type male. ∗ indicates p ≤ 0.01 by a χ2 test. Data show mean ± SD from two independent experiments.
(D) Expression levels of z-THOR in testicular somatic cells as well as in 6 Hoechst-profiled subpopulations of testicular germ cells. Data show mean ± SD.
(E) Bar plot demonstrates expression of 12 zebrafish orthologs of the canonical IGF2BP1 target genes by qRT-PCR in zebrafish embryos. Expression represented as log2 of the fold change of either THOR−/− compared to wild-type embryos (red) or THOR overexpression compared to control mCherry. Data show mean ± SD from one of the two independent experiments.
(F) Kaplan-Meier curve of melanoma free period for mitfa promoter driven NRAS 61K zebrafish in either THOR−/− background or wild-type background. p values were determined using a log-rank test.
(G) Schematic describing the generation of the h-THOR-overexpression melanoma zebrafish model.
(H) Kaplan-Meier curve of melanoma-free period for p53−/− zebrafish co-injected with either mitfa promoter driven NRAS 61K + mitfa promoter driven human THOR or mitfa promoter driven NRAS 61K + mCherry. p values were determined using a log rank test.
(I) Percentage of body area covered in melanoma for mCherry and h-THOR injected zebrafish also containing mitfa-promoter-driven NRAS 61K. ∗ indicates p ≤ 0.01 obtained by a two-tailed Student’s t test.
(J) Specimen example of NRAS 61K driven melanomas in zebrafish co-injected with mitfa-promoter-driven h-THOR or mitfa-promoter-driven mCherry in a p53−/− background.
Data show mean ± SE for all panels with error bars. See also Figure S7.
Reprinted from Cell, 171, Hosono, Y., Niknafs, Y.S., Prensner, J.R., Iyer, M.K., Dhanasekaran, S.M., Mehra, R., Pitchiaya, S., Tien, J., Escara-Wilke, J., Poliakov, A., Chu, S.C., Saleh, S., Sankar, K., Su, F., Guo, S., Qiao, Y., Freier, S.M., Bui, H.H., Cao, X., Malik, R., Johnson, T.M., Beer, D.G., Feng, F.Y., Zhou, W., Chinnaiyan, A.M., Oncogenic Role of THOR, a Conserved Cancer/Testis Long Non-coding RNA, 1559-1572.e20, Copyright (2017) with permission from Elsevier. Full text @ Cell