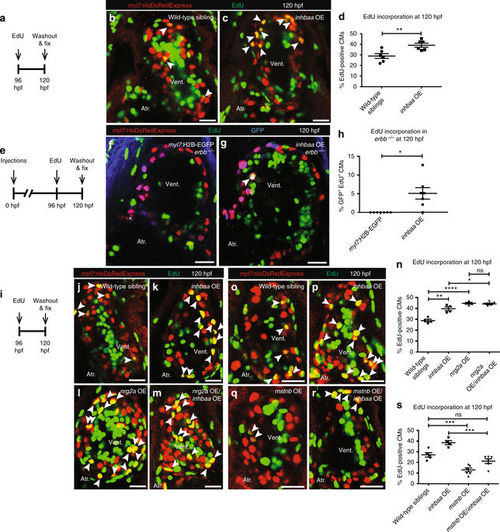
inhbaa GOF promotes CM proliferation independently of ErbB2 signaling and competes with mstnb GOF. a Experimental setup of EdU treatment, followed by fixation. b, c Tg(myl7:nlsDsRedExpress) hearts of wild-type sibling and inhbaa OE larvae at 120 hpf; α-DsRed (red), EdU (green). White arrowheads point to proliferating CMs (EdU+/DsRed+). d Quantification of CM proliferation in wild-type sibling (n = 6) and inhbaa OE (n = 6) ventricles at 120 hpf. e Experimental setup of injections, EdU exposure, followed by fixation. f, g Tg(myl7:nlsDsRedExpress) hearts of myl7:H2B-EGFP and myl7:inhbaa-2A-H2B-EGFP(inhbaa OE) injected erbb −/− larvae at 120 hpf; α-DsRed (red), α-GFP (blue), EdU (green). White arrowheads point to proliferating CMs (EdU+/DsRed+/GFP+). h Quantification of CM proliferation in myl7:H2B-EGFP (n = 7) and inhbaa OE (n = 7) injected ventricles at 120 hpf. i Experimental setup of EdU treatment, followed by fixation. j–m Tg(myl7:nlsDsRedExpress) hearts of wild-type sibling, inhbaa OE, nrg2a OE, and nrg2a OE/inhbaa OE larvae at 120 hpf; α-DsRed (red), EdU (green). White arrowheads point to proliferating CMs (EdU+/DsRed+). n Quantification of CM proliferation in wild-type sibling (n = 4), inhbaa OE (n = 4), nrg2a OE (n = 4), and nrg2a OE/inhbaa OE (n = 5) ventricles at 120 hpf. o–r Tg(myl7:nlsDsRedExpress) hearts of wild-type sibling, inhbaa OE, mstnb OE, and mstnb OE/inhbaa OE larvae at 120 hpf; α-DsRed (red), EdU (green). s Quantification of CM proliferation in wild-type sibling (n = 5), inhbaa OE (n = 4), mstnb OE (n = 6), and mstnb OE/inhbaa OE (n = 6) ventricles at 120 hpf. All cell counts were performed on non-overlapping confocal planes (thickness, 1 µm) (data are mean ± s.e.m., ns: no significant changes observed, *P ≤ 0.05, **P ≤ 0.01, ***P ≤ 0.001 and ****P ≤ 0.0001—Student’s t test, two-tailed). Scale bars, 20 µm. vent., ventricle; atr., atrium
|
