
Fig. 3
- ID
- ZDB-FIG-180419-3
- Publication
- Lovett-Barron et al., 2017 - Ancestral Circuits for the Coordinated Modulation of Brain State
- Other Figures
- All Figure Page
- Back to All Figure Page
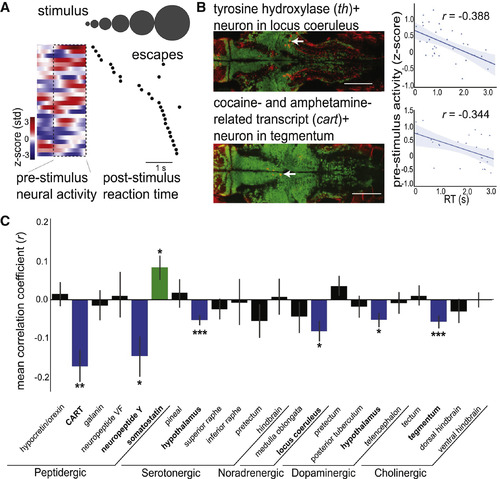
Diverse Neuromodulatory Cell Types Are Correlated with Alertness States (A) Example cart+ tegmentum neuron, with pre-stimulus time series and onset to first escape-like tail movement for each trial (black dots), ordered by RT. (B) Example data from individual th+ locus coeruleus neuron (top) and cart+ tegmentum neuron (bottom). (Left) Overlays of antibody label (red) with live GCaMP (green) in example Z plane after volume registration (neurons identified with white arrow). Scale bars: 100 μm. (Right) Scatterplot of mean pre-stimulus neural activity and RT. Solid line: linear regression; shaded region: 95% confidence interval. (C) Summary data from 22 neuromodulatory cell types, displaying correlation coefficients from comparison of RT and pre-stimulus neural activity. Bars are mean ± SEM, n = 34 fish. Significance values are determined by one-sample Wilcoxon signed-rank tests and false discovery rate correction for multiple comparisons. Groups are colored according to their correlations: blue (negative correlation), green (positive correlation), or black (no correlation). See Figure S3 for details and examples of each cell type and Figure S4 for additional functional characterization. ∗p < 0.05, ∗∗p < 0.01, ∗∗∗p < 0.001. |
Reprinted from Cell, 171(6), Lovett-Barron, M., Andalman, A.S., Allen, W.E., Vesuna, S., Kauvar, I., Burns, V.M., Deisseroth, K., Ancestral Circuits for the Coordinated Modulation of Brain State, 1411-1423.e17, Copyright (2017) with permission from Elsevier. Full text @ Cell