Fig. 1
- ID
- ZDB-FIG-180321-2
- Publication
- Hozumi et al., 2017 - Nuclear movement regulated by non-Smad Nodal signaling via JNK is associated with Smad signaling during zebrafish endoderm specification
- Other Figures
- All Figure Page
- Back to All Figure Page
|
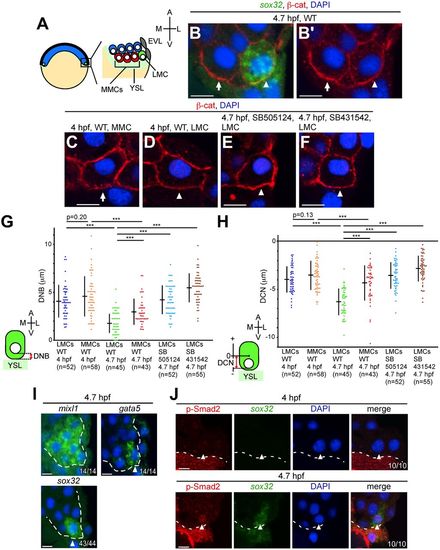
Nuclear movement toward the YSL in LMCs occurs at 4.7 hpf. (A) Illustration of the zebrafish blastula embryo (left) and location of marginal cells (right). LMCs refers to the most laterally located marginal cells (green); MMCs, medial marginal cells (red); EVL, enveloping layer; YSL, yolk syncytial layer; A, animal; V, vegetal; M, medial; L, lateral. (B-F) Transverse sections of wild-type (WT) and TGFβ type I receptor inhibitor (SB505124 or SB431542)-treated embryos. The cell membrane and the nucleus are visualized by β-catenin (β-cat) and DAPI staining, respectively. The endoderm marker sox32 was detected by FISH (B only). Arrows and arrowheads indicate MMCs and LMCs, respectively. (G) Minimum distance between the most vegetal position of the nucleus and the blastoderm/YSL boundary (DNB) in WT and TGFβ receptor inhibitor-treated embryos. (H) Minimum distance between the center of the cell and the most vegetal position of the nucleus (DCN) relative to the animal-vegetal axis in WT and TGFβ receptor inhibitor-treated embryos. In the DCN, the center of the cell is defined as zero; the animal and vegetal sides relative to the center of cell are set as plus and minus along the animal and vegetal axes, respectively. (G,H) ***P<0.001. n, number of nuclei examined. (I) Transverse sections of WT embryos showing mixl1, gata5 and sox32 FISH (green) at 4.7 hpf. DAPI, blue. The number of embryos showing this pattern among the total examined is indicated bottom right. Arrowheads indicate LMCs. Dashed lines indicate the boundary between the blastoderm and the YSL or EVL. (J) Transverse sections of WT embryos; p-Smad2 and sox32 were visualized via immunohistochemical staining and FISH, respectively. Arrowheads indicate the nucleus in LMCs. Dashed lines indicate the boundary between the blastoderm and the YSL. Scale bars: 10 µm. |

