
Fig. 4
- ID
- ZDB-FIG-180221-39
- Publication
- Zhao et al., 2018 - Analysis of two transcript isoforms of vacuolar ATPase subunit H in mouse and zebrafish
- Other Figures
- All Figure Page
- Back to All Figure Page
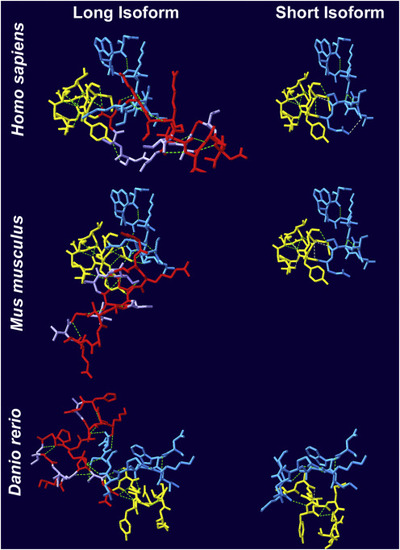
H-bonds and phosphorylation sites between two isoforms. The number and location of H-Bond are compared using Swiss-PdbViewer. The eighteen amino acids in long isoform are shown in red, and the ten amino acids before and after this region are labeled in blue and yellow, respectively. The H-bonds (≤ 3.3) are displayed in green dash line, and the H-Bonds (> 3.3) are labeled in gray dash line. There are six to eight H-bonds among the eighteen amino acids region in different species. Among the inserting eighteen amino acids, the phosphorylation sites are displayed in light cyan. There are six phosphorylation sites in this region of human and mouse protein and five phosphorylation sites in that of zebrafish. (For interpretation of the references to colour in this figure legend, the reader is referred to the web version of this article.) |
Reprinted from Gene, 638, Zhao, W., Zhang, Y., Yang, S., Hao, Y., Wang, Z., Duan, X., Analysis of two transcript isoforms of vacuolar ATPase subunit H in mouse and zebrafish, 66-75, Copyright (2018) with permission from Elsevier. Full text @ Gene