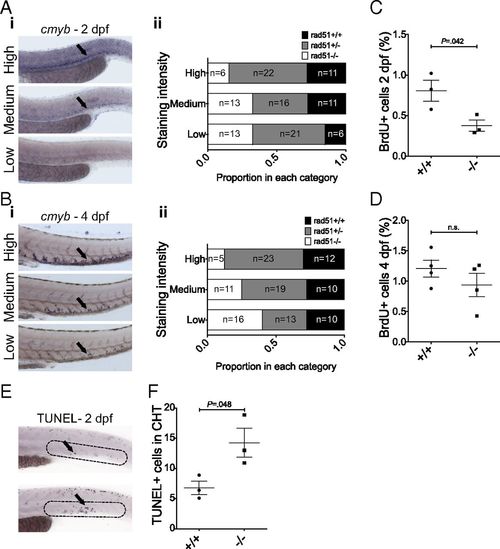
The rad51sa23805 HSPC defect starts during embryonic development. (A) ISH using a cmyb-specific probe at 2 dpf; the arrow shows HSPCs. Representative images of the three different staining categories are shown (i) and a quantification of the different genotypes (ii) n = 119 from two clutches. (B) ISH using a cmyb-specific probe at 4 dpf; the arrow shows HSPCs. Representative images of the three different staining categories are shown (i) and a quantification of the different genotypes (ii), n = 120 from two clutches. (C) Quantification of BrdU+ cells in the tail at 2 dpf. Two-sided Student’s t test, P = 0.042, n+/+ = 3, n−/− = 3. (D) Quantification of BrdU+ cells in the CHT at 4 dpf. Two-sided Student’s t test, n+/+ = 4, n−/− = 4. Bars represent mean ± SEM in C and D. n.s., not significant. (E) Representative images of TUNEL-stained 2 dpf embryos from a rad51+/− in-cross. Dotted lines indicate the area of the CHT that was scored. Arrows indicate TUNEL+ cells. (F) Quantification of three clutches of TUNEL-stained 2 dpf rad51+/− in-crosses. Each clutch was scored blindly and consisted of 10+/+ and 10−/− embryos each. Shown is the mean of all clutches ± SEM. (Magnification, 100× in all images.)
|
