
Fig. 1
- ID
- ZDB-FIG-180131-12
- Publication
- Escobar-Aguirre et al., 2017 - Microtubule-actin crosslinking factor 1 (Macf1) domain function in Balbiani body dissociation and nuclear positioning
- Other Figures
- All Figure Page
- Back to All Figure Page
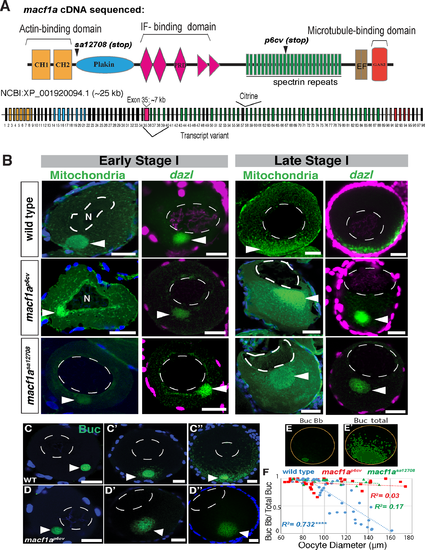
Macf1a is essential in relocalizing Buc from the Bb to the oocyte cortex. A) macf1a ovary cDNA from zebrafish was sequenced to determine the Macf1a domains that are expressed. CH = calponin-homology domain (yellow); PRD = Plectin repeat domain (pink); EF = Ca+2 binding domain (brown); Gas2: MT binding domain (red); IF = Intermediate filament. The exons are numbered and color-coded according to the domains. The premature stop codon locations in mutant alleles, macf1asa12708 and macf1ap6cv, are shown. B) DiOC6 staining (mitochondria, green) and dazl in situ (green) in early and late stage I oocytes, labeling in WT the Bb prior to disassembly (early stage I) and the disassembled Bb at the cortex (late stage I). macf1ap6cv and macf1asa12708 mutant oocytes display a normal Bb in early stage I, but in late stage I the Bb enlarges and never disassembles. In addition, macf1a mutants show an acentric nuclear position compared to WT. DiOC6: N≥5 ovaries, >30 WT, macf1ap6cv, and macf1asa12708 oocytes. dazl in situ: N = 5 ovaries, >30 WT, 25 macf1ap6cv and 35 macf1asa12708 oocytes. C-D) Buc staining (green) to visualize Bb disassembly in stage I oocytes in WT and macf1a mutants (C-D, images correspond to different oocytes). E) Quantification method for Bb disassembly during stage I. The two images (E-E’) correspond to a Z-stack from C” where green represents the areas of Buc Bb and Buc total of oocytes that were segmented according to Buc signal intensity (see methods). The yellow circle marks the oocyte perimeter, which was used to estimate the oocyte diameter. F) Bb disassembly versus oocyte size (60 μm diameter early stage I to 160 μm late stage I) in WT, macf1ap6cv and macf1asa12708 mutants. Buc Bb/Total Buc (a quantitative measure of Bb disassembly) decreases as oocyte diameter (μm) increases, and this correlation between X and Y values is significant in WT (R2 = 0.732, correlation coefficient. **** P value < 0.0001), but not in macf1ap6cv (R2 = 0.03, P value = 0.2377) and macf1asa12708 (R2 = 0.17, P value = 0.1764). N≥ 3 ovaries, WT and mutant oocytes. DAPI staining labels DNA (blue or magenta) and marks follicle cells. Images are single optical sections, except for E-E’. Arrowheads indicate Bb and N the nucleus. Scale bar: 20 μm. All images are representative from at least 3 experiments. |
| Gene: | |
|---|---|
| Antibody: | |
| Fish: | |
| Anatomical Terms: | |
| Stage: | Adult |
| Fish: | |
|---|---|
| Observed In: | |
| Stage: | Adult |