
Fig. 1
- ID
- ZDB-FIG-180124-18
- Publication
- Moriya et al., 2017 - Bpifcl modulates kiss2 expression under the influence of 11-ketotestosterone in female zebrafish
- Other Figures
- All Figure Page
- Back to All Figure Page
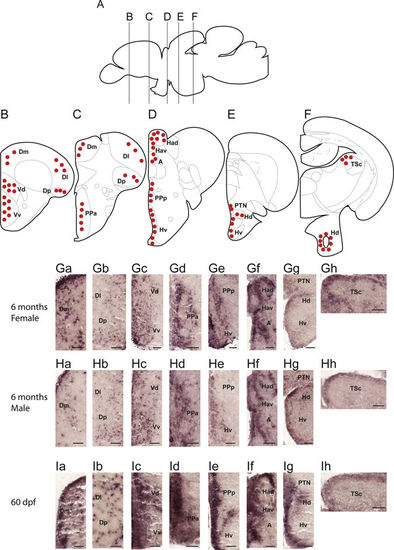
Localisation of bpifcl mRNA expression in zebrafish brain. (A) Schematic sagittal drawing of the zebrafish brain. (B–F) Lines in A indicate levels of coronal sections. Schematic coronal brain drawing of zebrafish showing the distribution of bpifcl (red dots) mRNA-containing cells in the brain. (Ga–Gh) Photomicrographs of bpifcl-expressing cells in 6 months old female zebrafish brain. (Ha–Hh) Photomicrographs of bpifcl-expressing cells in 6 months old male zebrafish brain. (Ia–Ih) Photomicrographs of bpifcl-expressing cells in 60 days post-fertilisation (dpf) fish brain. For abbreviations, see Supplementary Abbreviation. Scale bar: 50 μm. |