
Fig. 3
- ID
- ZDB-FIG-180118-23
- Publication
- Bayramli et al., 2017 - Patterned Arrangements of Olfactory Receptor Gene Expression in Zebrafish are Established by Radial Movement of Specified Olfactory Sensory Neurons
- Other Figures
- All Figure Page
- Back to All Figure Page
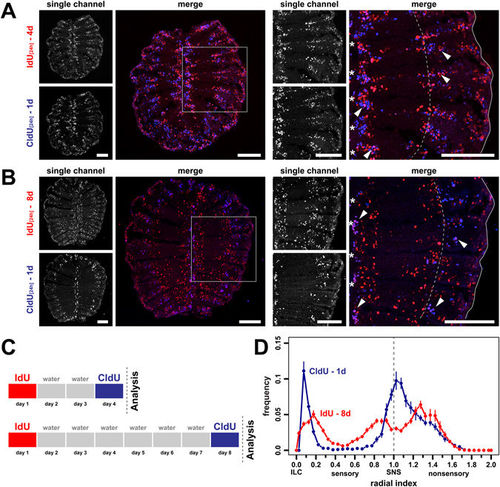
Simultaneous labeling of old and young cell populations in the same olfactory epithelium. (A) Cross sections through the OE of fish that were incubated with IdU (red) for 24 h followed by a second 24 h incubation with CldU (blue) two days later. Single channel exposures are shown to the left, the merged channels to the right. The panel on the right shows a higher power view of one side of the OE indicated by the grey box on the left. Single IdU- and CldU-positive cells as well as double positive cells (pink, arrowheads) can be detected. The younger CldU-positive and CldU/IdU double positive cells are confined to the interlamellar curves (asterisks) and regions peripheral to the sensory/nonsensory border (dotted line). The older single IdU-positive cells occupy more central positions in the sensory OE. Scale bars: 100 µm. (B) Same experiment as in A. but with a 6d time interval between consecutive labelling with IdU and CldU. IdU single-positive cells advanced further from the ILC and SNS towards the centre of the sensory epithelium. Scale bars: 100 µm. (C) Schematic representation of the experimental setup for A. (top) and B. (bottom). (D) Frequency distributions of IdU- (red) and CldU (blue) single-positive cells from the 8d experiment shown in B. The positions of cells were normalized to the length of the sensory OE between the interlamellar curves (ILCs) and the sensory/nonsensory brder (SNS). The dotted line indicates the position of the SNS. The older IdU-labeled cells show a broader, more central distribution than the younger CldU-positive cells that are concentrated at the ILC and SNS. The graph represents the positions of 4.787 IdU-positive and 3.778 CldU-positive cells from 20 sections of 2 fish, mean ± SEM. |