
Fig. 3
- ID
- ZDB-IMAGE-180118-23
- Publication
- Bayramli et al., 2017 - Patterned Arrangements of Olfactory Receptor Gene Expression in Zebrafish are Established by Radial Movement of Specified Olfactory Sensory Neurons
- All Figures
- Figures for Bayramli et al., 2017
|
Fig. 3
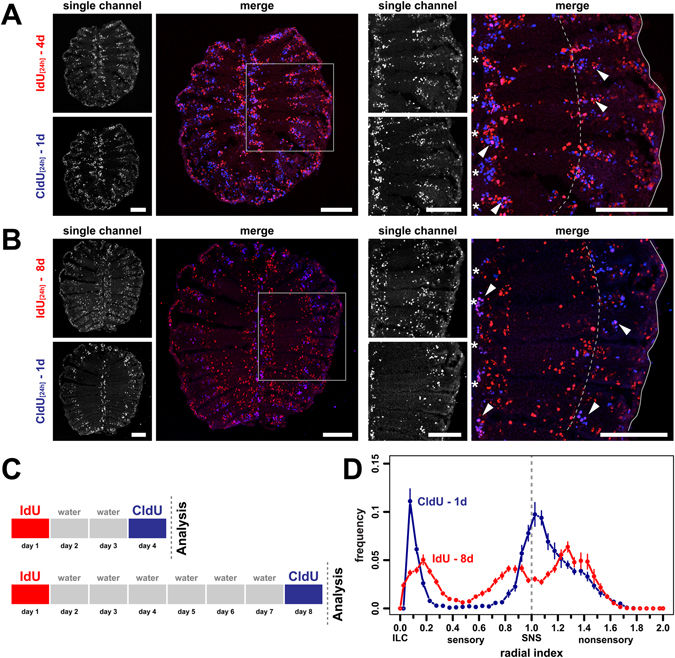
Simultaneous labeling of old and young cell populations in the same olfactory epithelium. (A) Cross sections through the OE of fish that were incubated with IdU (red) for 24 h followed by a second 24 h incubation with CldU (blue) two days later. Single channel exposures are shown to the left, the merged channels to the right. The panel on the right shows a higher power view of one side of the OE indicated by the grey box on the left. Single IdU- and CldU-positive cells as well as double positive cells (pink, arrowheads) can be detected. The younger CldU-positive and CldU/IdU double positive cells are confined to the interlamellar curves (asterisks) and regions peripheral to the sensory/nonsensory border (dotted line). The older single IdU-positive cells occupy more central positions in the sensory OE. Scale bars: 100 µm. (B) Same experiment as in A. but with a 6d time interval between consecutive labelling with IdU and CldU. IdU single-positive cells advanced further from the ILC and SNS towards the centre of the sensory epithelium. Scale bars: 100 µm. (C) Schematic representation of the experimental setup for A. (top) and B. (bottom). (D) Frequency distributions of IdU- (red) and CldU (blue) single-positive cells from the 8d experiment shown in B. The positions of cells were normalized to the length of the sensory OE between the interlamellar curves (ILCs) and the sensory/nonsensory brder (SNS). The dotted line indicates the position of the SNS. The older IdU-labeled cells show a broader, more central distribution than the younger CldU-positive cells that are concentrated at the ILC and SNS. The graph represents the positions of 4.787 IdU-positive and 3.778 CldU-positive cells from 20 sections of 2 fish, mean ± SEM.