
Fig. 5
- ID
- ZDB-FIG-180116-6
- Publication
- Gupta et al., 2017 - Myosin-1 inhibition by PClP affects membrane shape, cortical actin distribution and lipid droplet dynamics in early Zebrafish embryos
- Other Figures
- All Figure Page
- Back to All Figure Page
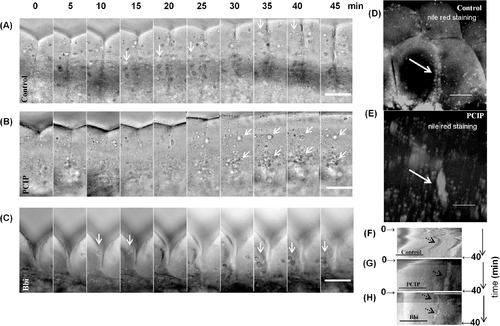
LDs gradually accumulate at the cleavage furrow of PClP treated embryo. (A-C) Lateral views of embryo, as observed in Fig 2A, Zoomed in on first cleavage furrow, (A) Control embryo from approximately 40 min post fertilization, montage of every 5 min, arrows indicates LDs near the first cleavage furrow. (B) Myo1 inhibited embryo from approximately 40 min post fertilization, montage of every 5 min. Arrows indicate accumulation of LDs at the first cleavage furrow line. (C) Myo2 inhibited embryo from approximately 40 min post fertilization, montage of every 5 min. Arrows indicate LDs near the first cleavage furrow. (D) Nile red staining of first cleavage furrow with lipid droplets shown by arrow in control embryo. (E) Nile red staining of first cleavage furrow with lipid droplet clump shown by arrow in Myo1 inhibited embryo. (F) Control, (G) Myo1 inhibited and (H) Myo2 inhibited embryos, kymograph view of average intensity along 10 μm line on both sides of the first cleavage furrow, ~ for approximately 40 min as shown in panels 5A-5C. Time is indicated along vertical axis and correlates with images in panel (5A-5C), approximate location of start and finish of 40 min time in kymographs are marked by arrows. LDs are indicated by black arrowheads. Scale bars are 50 μm in all images of this figure. |