
Fig. 3
- ID
- ZDB-FIG-180116-4
- Publication
- Gupta et al., 2017 - Myosin-1 inhibition by PClP affects membrane shape, cortical actin distribution and lipid droplet dynamics in early Zebrafish embryos
- Other Figures
- All Figure Page
- Back to All Figure Page
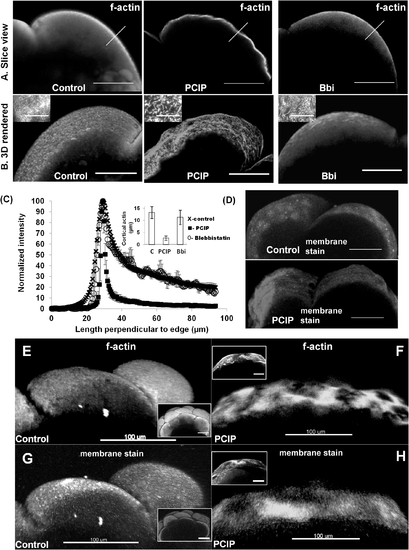
Reorganization of blastomeric cortical actin and membrane upon MyoI inhibition by PClP. (A) Slice views- Cortical actin distribution profile in control (carrier DMSO treated) 1hpf (left panel), PClP treated 1 hpf (middle panel) and blebbistatin treated 1 hpf embryo (right panel). (B) 3D rendered in 100 μm cross section of embryos- Cortical actin distribution profile in control 1hpf (left panel), PClP treated 1 hpf (middle panel) and blebbistatin treated 1 hpf embryos (right panel). Insets, zoomed in view by TIRF imaging. (C) Normalized actin (phalloidin-488) intensity profile perpendicular (along arrows in (A)), to the surface in control (cross), PClP (box) and blebbistatin (circle) treated embryos. Inset- comparison of cortical actin thickness measured by FWHM (n = 5 embryo each, error bars indicate standard deviation), along the line as indicated in Fig 3A. (D) 3D rendered in 100 μm cross section of embryos- Menbrane surface is stained with cell mask plasma membrane dye, control 1 hpf (top panel) and PClP treated 1hpf (bottom panel). (E-H) 3D rendered in 100 μm cross section of embryos. (E) Cortical actin distribution by phalloidin-alexa-488 staining in control embryo, 2 hpf. Inset- full blastomere. (F) Cortical actin distribution in 2 hpf Myo1 inhibited embryo by PClP, phalloidin-alexa-488 staining. Inset- full blastomere. (G) Membrane surface is stained with cell mask plasma membrane dye in control 2 hpf embryo. Inset- full blastomere. (H) Membrane surface is stained with cell mask plasma membrane dye in 2 hpf Myo1 inhibited embryo by PClP. Inset- full blastomere. Scale bars are 100μm everywhere in this figure except 5 μm in zoomed inset of (A&B). |