
Fig. 3
- ID
- ZDB-FIG-180110-13
- Publication
- Wiles et al., 2016 - Host Gut Motility Promotes Competitive Exclusion within a Model Intestinal Microbiota
- Other Figures
- All Figure Page
- Back to All Figure Page
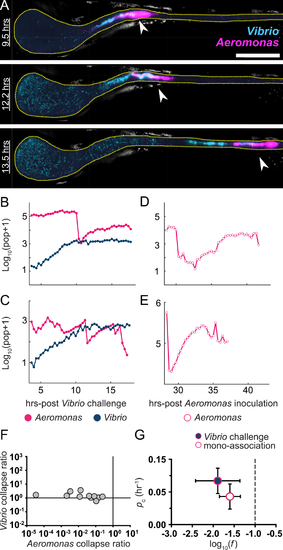
Aeromonas experiences sharp drops in population size that are intensified during Vibrio challenge. (A) MIPs of Aeromonas (magenta) and Vibrio (cyan) in a larval zebrafish intestine. Scale bar: 200 μm. The fish was initially colonized at 4 dpf with Aeromonas, challenged 24 hr later by inoculation with Vibrio, and then imaged every 20 min for 14 hr. The times indicated denote hours post-challenge. In all images, the region shown spans about 80% of the intestine, with the anterior on the left. Image contrast in both color channels is enhanced for clarity. Yellow dotted line roughly indicates the lumenal boundary. As time progresses, the anterior growth of Vibrio as well as abrupt changes in the Aeromonas distribution (arrows) are evident. (B,C) Total bacterial abundance, derived from image data, for Aeromonas and Vibrio in two representative fish inoculated and challenged as in panel A, as a function of time following the Vibrio inoculation. Sharp drops of over an order of magnitude in the Aeromonas population, but not the Vibrio population, are evident. (D,E) Total abundance for Aeromonas in mono-associations as a function of time post-inoculation, in two representative fish. Sudden declines are also observed, though in general the populations recover to approximately pre-collapse levels. (F) The ratio, f, of the abundance immediately after to that before population drops, for Aeromonas challenged by Vibrio; this ratio spans many orders of magnitude (horizontal axis). At the same time points, the Vibrio populations are essentially unchanged, with ratios of populations afterward to before being close to one (vertical axis). (G) Characteristics of Aeromonas population collapses. Circles and bars indicate the mean and standard deviation, respectively, of f and pc, the magnitude and rate of collapse occurrence, for both mono-associations and Aeromonas challenged by Vibrio. The dashed line at f = 0.1 indicates the threshold for identification of collapses. Underlying data for B–G are provided in S1 Data. |