
FIGURE
Fig. 6
- ID
- ZDB-FIG-180105-13
- Publication
- Yang et al., 2017 - Evaluation of the Cardiotoxicity of Evodiamine In Vitro and In Vivo
- Other Figures
- All Figure Page
- Back to All Figure Page
Fig. 6
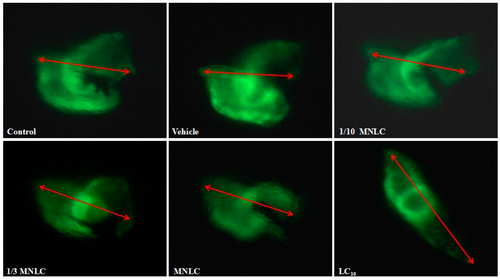
The measurement of SV–BA distance following exposure to evodiamine for 24 h. The arrows indicate the direct distance between the centers of the SV and BA. |
Expression Data
Expression Detail
Antibody Labeling
Phenotype Data
Phenotype Detail
Acknowledgments
This image is the copyrighted work of the attributed author or publisher, and
ZFIN has permission only to display this image to its users.
Additional permissions should be obtained from the applicable author or publisher of the image.
Full text @ Molecules