
Image
|
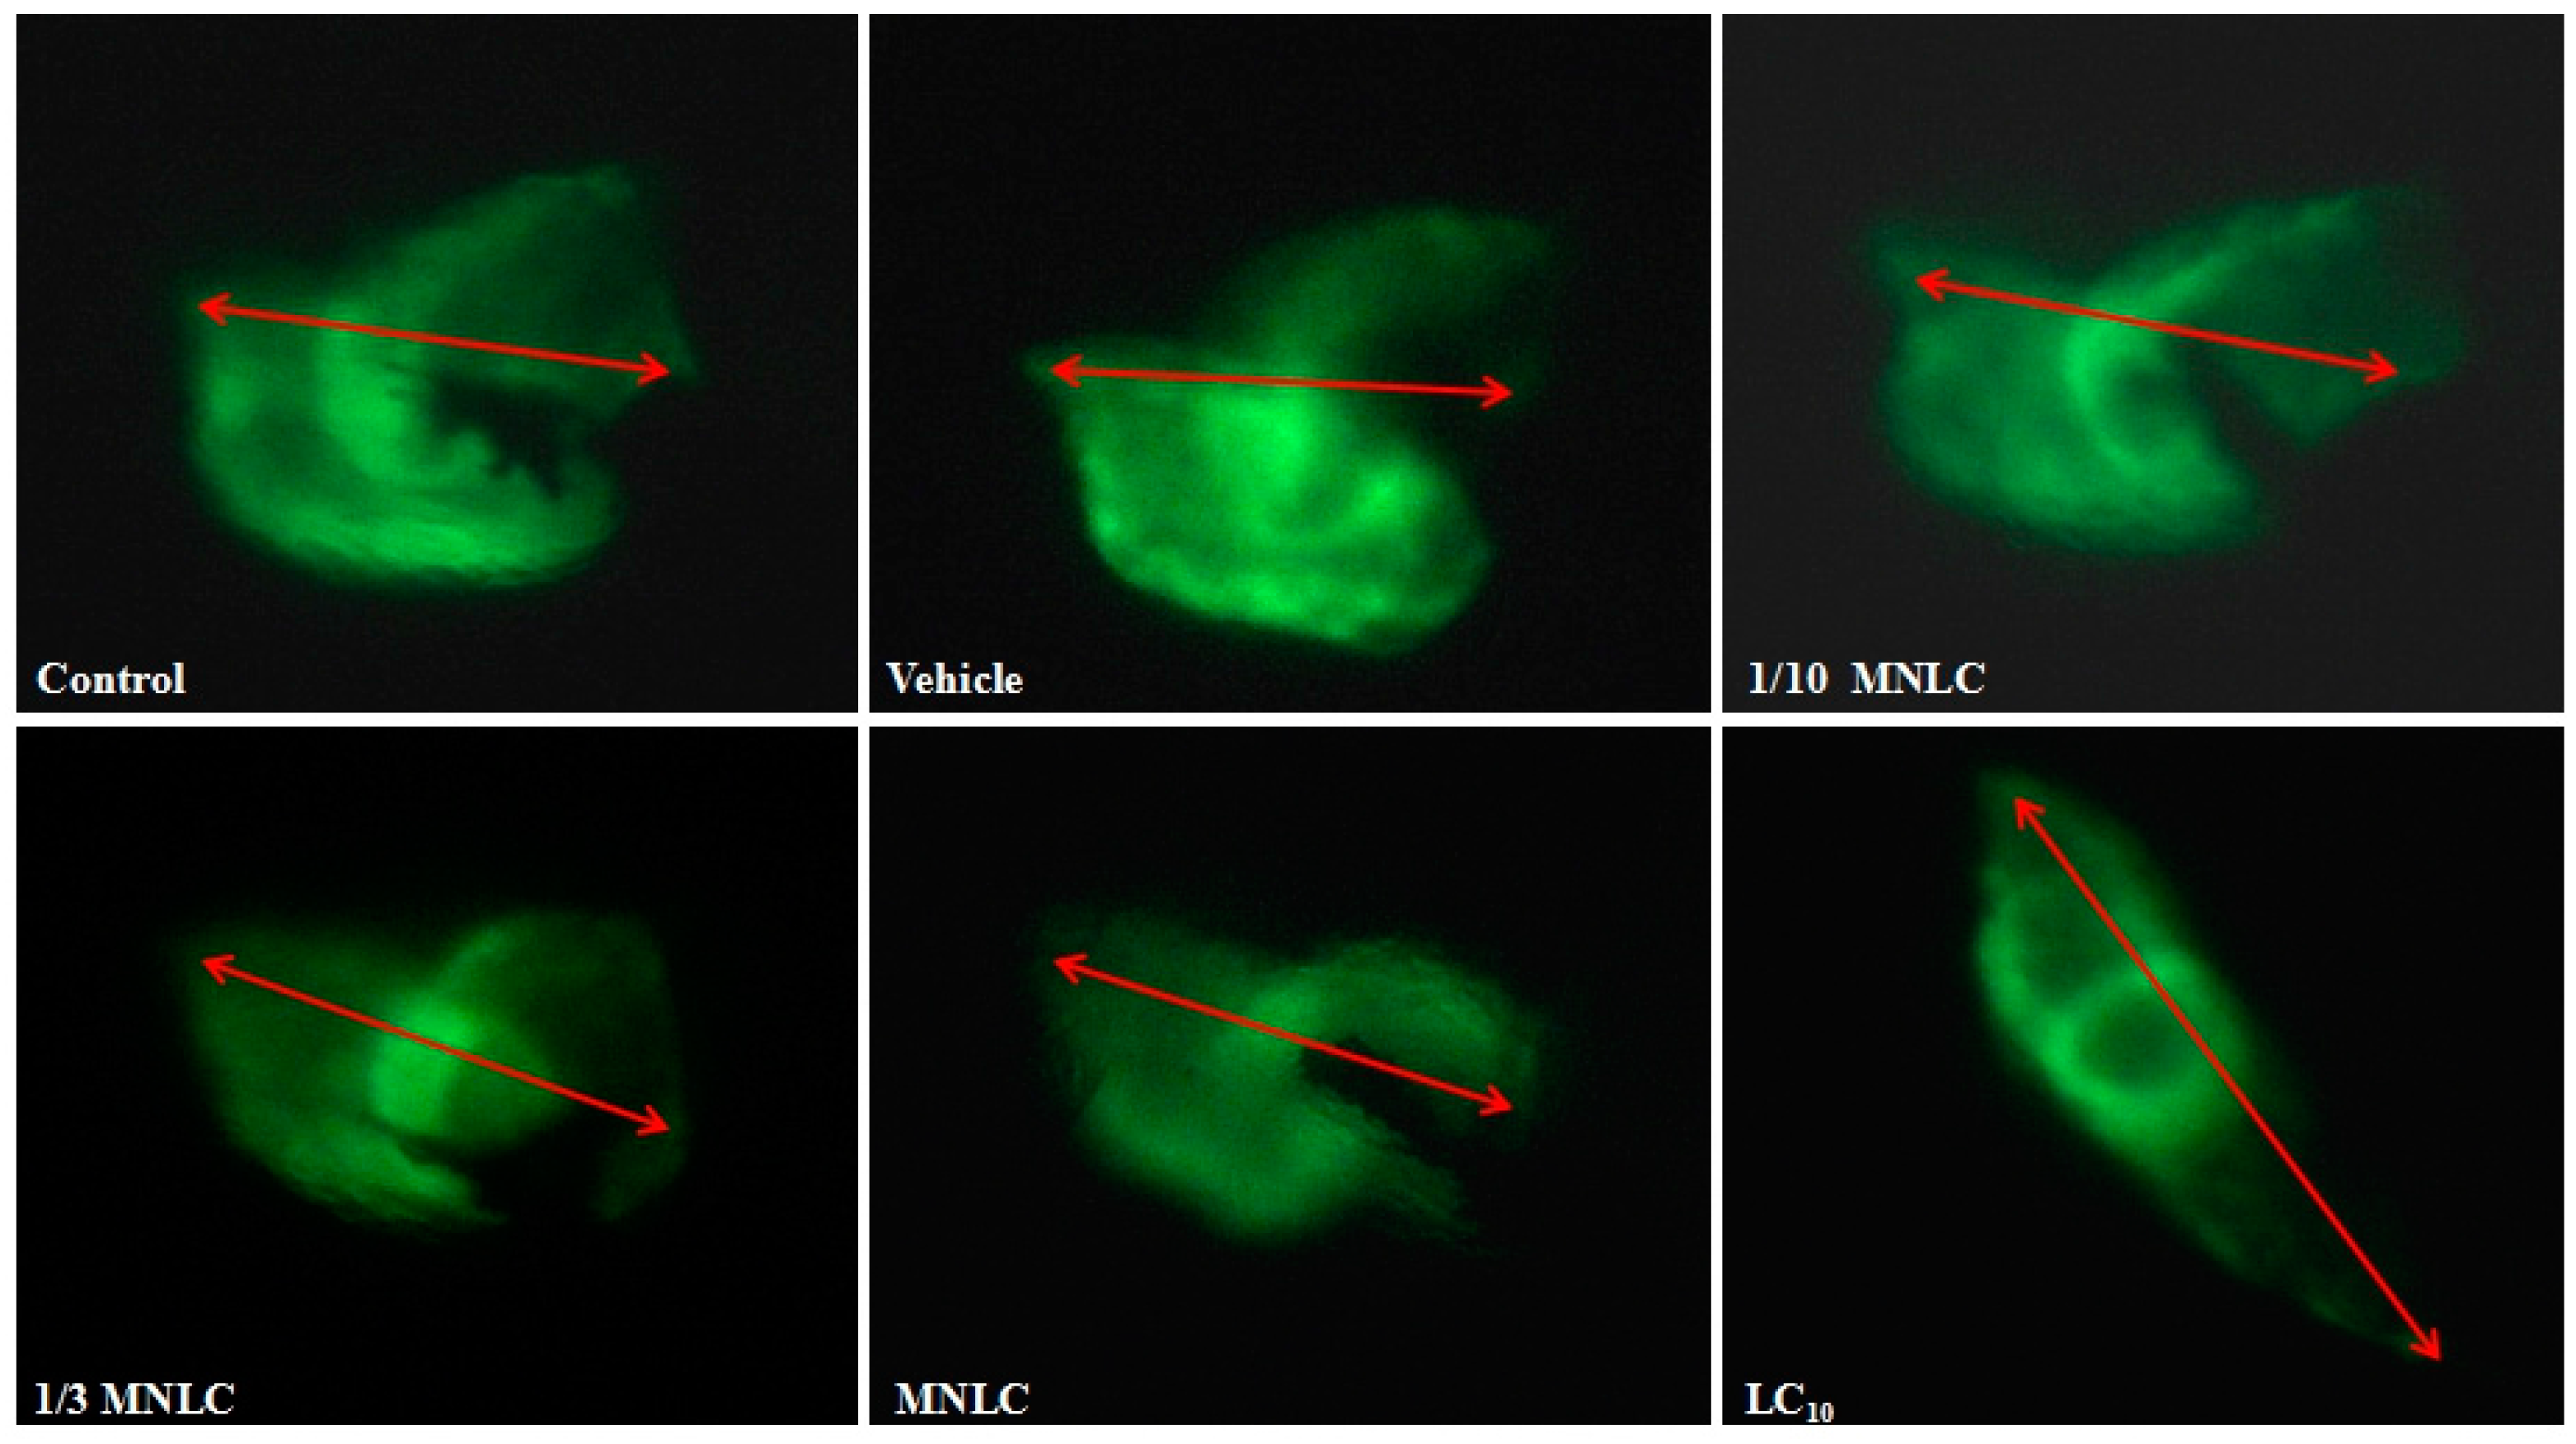
Figure Caption
Fig. 6
The measurement of SV–BA distance following exposure to evodiamine for 24 h. The arrows indicate the direct distance between the centers of the SV and BA.
Acknowledgments
This image is the copyrighted work of the attributed author or publisher, and
ZFIN has permission only to display this image to its users.
Additional permissions should be obtained from the applicable author or publisher of the image.
Full text @ Molecules