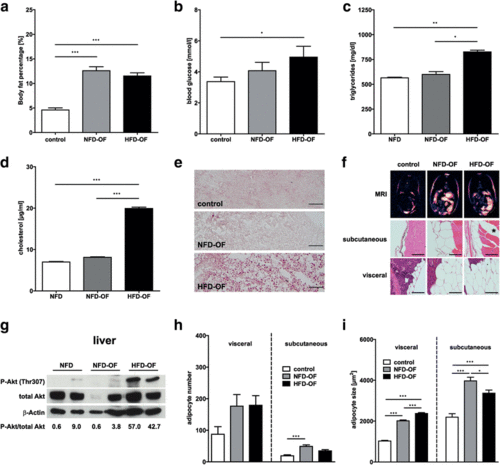
Phenotypic characterization of diet-induced obesity in zebrafish. Overfeeding of zebrafish with either NFD or HFD resulted in a significant increase in body fat percentage (a) compared to control zebrafish. HFD-OF but not NFD-OF zebrafish showed significantly elevated fasting blood glucose levels (b), triglyceride levels (c) and cholesterol levels (d), and a prominent accumulation of lipids in the liver as indicated by Oilred-O staining of liver sections (e). Fat distribution was analyzed by MRI and hematoxylin-eosin staining of zebrafish cross sections and revealed an increase in the amount of both subcutaneous and visceral AT in NFD-OF and HFD-OF compared to control zebrafish (f). Exemplary images of zebrafish included in each of the analyzed dietary groups at week 8 of feeding are shown. Asterisk indicates intramuscular fat deposition in HFD-OF fish. Immunoblot analyses of liver lysates showed increased phosphorylation of Akt at Thr307 (Thr308 in human) in HFD-OF compared to NFD-OF and control zebrafish. The ratio of P-Akt to total Akt was analyzed using ImageJ software and is given underneath the immunoblot images (g). Detection of β-Actin served as loading control. Visceral and subcutaneous adipocyte number and adipocyte size were determined from hematoxylin-eosin-stained zebrafish sections using ImageJ software and were increased after overfeeding with NFD or HFD (h, i). Statistical analyses were performed using One-Way ANOVA and Bonferroni post-test and significant p-values are indicated. *, p < 0.05; **, p < 0.01; ***, p < 0.001; Scale bar in (h) represents 50 μm, Scale bar in (i) represents 100 μm; NFD, normal fat diet; HFD, high-fat-diet; OF, overfeeding; BMI, body mass index; MRI, Magnetic Resonance Imaging; AT, adipose tissue
|

