|
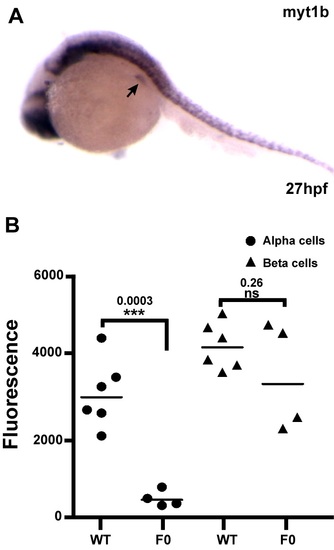
Expression and function of myt1b in zebrafish pancreas. A: Whole-mount ISH showing expression pattern of myt1b in zebrafish embryos at 27 hpf. High expression is detected in the dorsal pancreatic bud (indicated by the arrow) and in the central nervous system. B: Quantification of glucagon and insulin expression at 48 hpf in wild-type (non-injected) embryos and in embryos injected with the 4 CRISPR myt1a/b guide RNA and Cas9. Graph B shows the volume of all gcga+ cells and all ins+ cells measured in each embryo by the imaging software Imaris (see Methods) (each point is the volume measured in one embryo). This quantification indicates a statistically significant reduction of the volume of alpha cell mass while beta cell mass is not drastically affected in the injected (F0) embryos (results of one experiment).
|