
Fig. 4
- ID
- ZDB-FIG-171207-15
- Publication
- Zhao et al., 2015 - Multiplexed 3D FRET imaging in deep tissue of live embryos
- Other Figures
- All Figure Page
- Back to All Figure Page
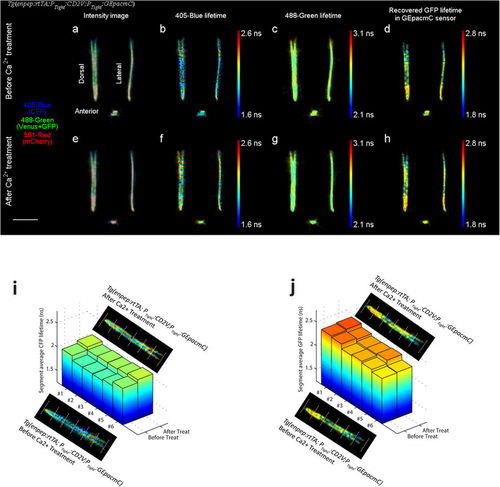
Dorsal, lateral and anterior projections of a 33 hpf Tg(enpep:rtTA; PTight:CD2V;PTight:GEpacmC) zebrafish embryo expressing both CD2V sensor and GEpacmC sensor, before and after being treated with 3 mM EGTA, 100 μM BAPTA-AM and 10 μM ionomycin for 2 hours to decrease cellular Ca2+ level. (a,e) False color fluorescence intensity projections before and after treatment, with 405-blue channel in blue, 488-green channel in green and 561-red channel in red. (b,f) 405-blue channel fluorescence lifetime (CFP lifetime) increased by 0.10 ns after treatment. (c,g) 488-green channel fluorescence lifetime (intensity weighted average of Venus and GFP lifetimes) was not affected by treatment. (d,h) Recovered GFP lifetime in GEpacmC sensor by the triple-channel intensity lifetime analysis. GFP lifetime was not changed by the treatment. (i) Average CFP lifetimes in 6 segments of kidney tubules divided equally, before and after the Ca2+ treatment. Despite significant variations in average CFP lifetimes between segments, CFP lifetimes in all segments increased after the treatment. (j) Average recovered GFP lifetimes in 6 tubule segments, before and after the Ca2+ treatment. GFP lifetime showed pronounced spatial variation. This spatial pattern of GFP lifetimes was not significantly altered by the Ca2+ treatment. Scale bar, 500 μm. |