
Fig. 2
- ID
- ZDB-FIG-171101-9
- Publication
- Vendrell-Llopis et al., 2015 - Evolutionary conserved brainstem circuits encode category, concentration and mixtures of taste
- Other Figures
- All Figure Page
- Back to All Figure Page
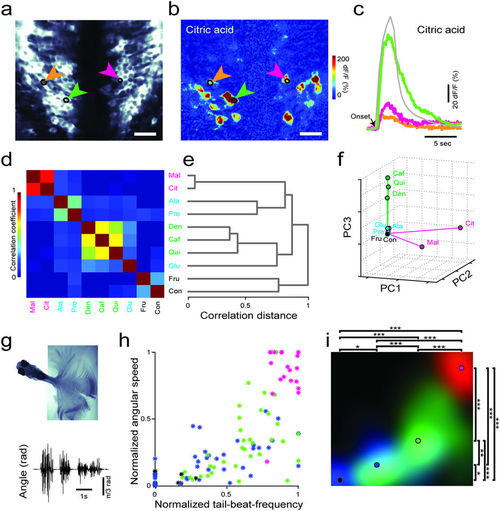
Taste categories are represented by dissimilar neural activity in the brainstem and generate different behaviors. (a) Optical section of the facial lobe in zebrafish brainstem expressing GCaMP5 under HuC promoter in most neurons. (b) Taste-evoked neural responses in the same optical section. Three arrows point to corresponding neurons from panel a. Scale bars 20 μm. Stimulus is citric acid 5 mM (c) Time course of the stimulus delivery in grey and time course of taste-evoked responses of example neurons color-coded same as in panel a. Black arrow indicates stimulus onset. (d) Pair-wise Pearson’s correlations between neural responses to different tastants. Text colors represent magenta = sour, green = bitter, blue = amino acids, black = sweet. n = 721 neurons, across 10 fishes. (e) Dendrogram showing the linkage among taste categories. Distances are measured based on correlations. (f) Representations of taste responses with the first 3 principle components. Total variance explained by first 3 principal components is 97.2% (g) Motor behavior of a semi-restrained zebrafish, obtained from a video sequence projected in time (top) and the associated tracking of the tail angle (bottom) in response to citric acid delivery. (h) TBF versus ATS in response to different taste categories, sour (magenta), bitter (green) and amino-acids (blue). Each dot represents an average of three different trials from individual fish (n = 12 fish) during the first four seconds. These values are normalized to the maximum response of each fish. Max ATS = 2.9 ± 1.2πrad/s, Max TBF = 24.2 ± 2.6 Hz. (i) Behavioral taste map obtained by filtering the graph in panel h. Colored circles represent averaged values across all fish. All categories generate significantly different behaviors. (***p = <0.0005, **p = <0.005, *p = <0.05 by Mann-Whitney U-test). For abbreviations, please see methods. |