
FIGURE
Fig. 1
- ID
- ZDB-FIG-171101-8
- Publication
- Vendrell-Llopis et al., 2015 - Evolutionary conserved brainstem circuits encode category, concentration and mixtures of taste
- Other Figures
- All Figure Page
- Back to All Figure Page
Fig. 1
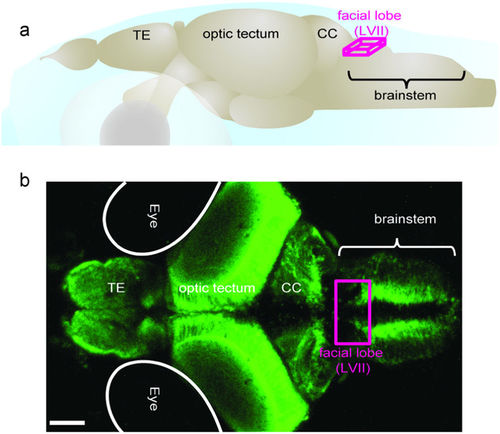
Schematic representation of zebrafish brain. (a) Illustration of 21 days old zebrafish brain. Magenta lines delineates the facial lobe of the brainstem, which is the main focus of this study. Major brain regions are labelled. Abbreviations: LVII facial lobe of the brainstem; CC, cerebellum; TE, telencephalon; (b) Maximum projection image of a 21dpf elavl3:GCaMP5 zebrafish brain across 320 μm depth. The magenta square indicates the facial lobe of zebrafish brainstem. Scale bar 100 μm. |
Expression Data
Expression Detail
Antibody Labeling
Phenotype Data
Phenotype Detail
Acknowledgments
This image is the copyrighted work of the attributed author or publisher, and
ZFIN has permission only to display this image to its users.
Additional permissions should be obtained from the applicable author or publisher of the image.
Full text @ Sci. Rep.