
FIGURE
Fig. 6
- ID
- ZDB-FIG-171006-10
- Publication
- Boot et al., 2017 - A fluorescence-based reporter for monitoring expression of mycobacterial cytochrome bd in response to antibacterials and during infection
- Other Figures
- All Figure Page
- Back to All Figure Page
Fig. 6
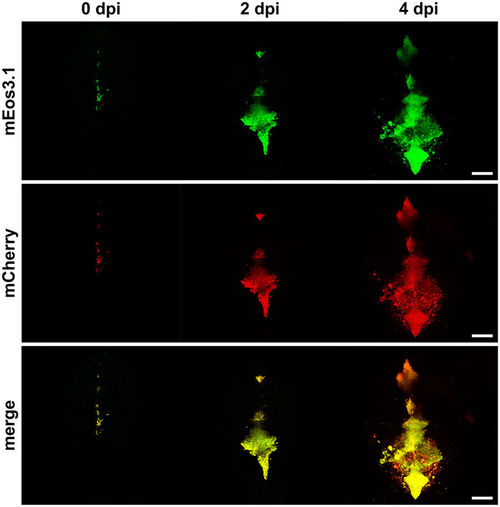
The cydA reporter in a zebrafish embryo model. Confocal microscopy images of casper zebrafish embryos at maximum projection. Time course of mEos3.1 and mCherry signals during infection (dpi = days post infection). Upper row: mEos3.1 signal indicates infection. Middle row; mCherry fluorescence indicates cydA transcription. Lower row: overlay of upper and middle row. Scale bars, 100 µm. Three independent experiment were performed, the images were selected from a representative experiment. |
Expression Data
Expression Detail
Antibody Labeling
Phenotype Data
Phenotype Detail
Acknowledgments
This image is the copyrighted work of the attributed author or publisher, and
ZFIN has permission only to display this image to its users.
Additional permissions should be obtained from the applicable author or publisher of the image.
Full text @ Sci. Rep.