
- Title
-
A fluorescence-based reporter for monitoring expression of mycobacterial cytochrome bd in response to antibacterials and during infection
- Authors
- Boot, M., Jim, K.K., Liu, T., Commandeur, S., Lu, P., Verboom, T., Lill, H., Bitter, W., Bald, D.
- Source
- Full text @ Sci. Rep.

Selected drugs are active in a zebrafish embryo infection model 3 days post treatment. (A) Infected fish, untreated (top) brightfield and fluorescence image as compared to a control, uninfected fish. (B) BDQ treated fish. (C) Treatment with Q203. (D) treatment with CFZ. Zebrafish infection experiments were performed with at least three biological replicates. |
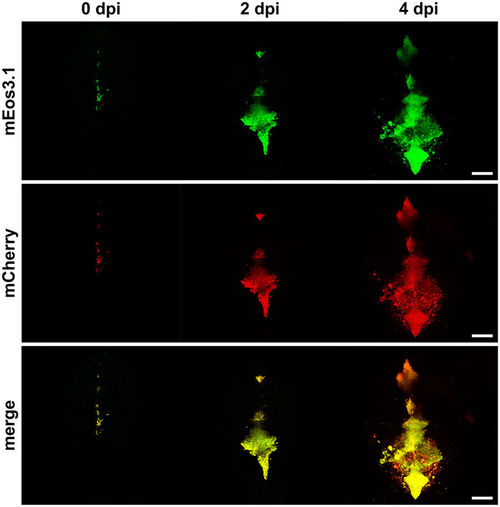
The cydA reporter in a zebrafish embryo model. Confocal microscopy images of casper zebrafish embryos at maximum projection. Time course of mEos3.1 and mCherry signals during infection (dpi = days post infection). Upper row: mEos3.1 signal indicates infection. Middle row; mCherry fluorescence indicates cydA transcription. Lower row: overlay of upper and middle row. Scale bars, 100 µm. Three independent experiment were performed, the images were selected from a representative experiment. |

BDQ decreases bacterial growth in the zebrafish hindbrain infection. Treatment of zebrafish embryos was started directly after infection. After 2dpi and 4dpi a significant reduction in bacterial load can be seen. |