
Fig. 4
- ID
- ZDB-FIG-170922-40
- Publication
- Liu et al., 2017 - Zebrafish B Cell Development without a Pre-B Cell Stage, Revealed by CD79 Fluorescence Reporter Transgenes
- Other Figures
- All Figure Page
- Back to All Figure Page
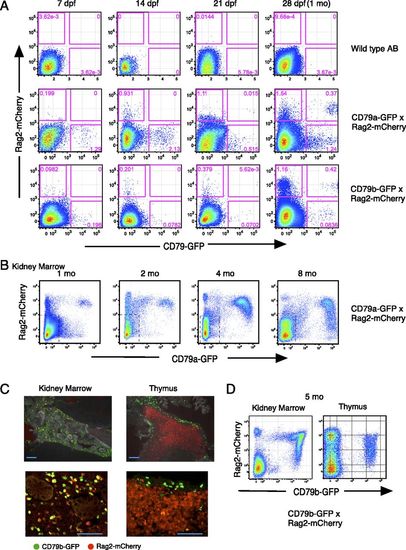
Identification of developing and mature B cells in CD79a-GFP and CD79b-GFP × Rag2-mCherry double-transgenic zebrafish. (A) B cells in young CD79a-GFP and CD79b-GFP zebrafish larvae identified by coexpression with Rag2:mCherry, analyzed by flow cytometry. Wild-type zebrafish AB line is shown as a control. Representative data of four to seven sample analyses from each day postferilization zebrafish are shown. (B) Kidney marrow of 1–8 mo CD79a-GFP × Rag2-mCherry. Dotted region is GFP−mCherry−. (C) Five month CD79b-GFP × Rag2-mCherry zebrafish. Low-power (top) and high-power (bottom) images of thin sections of kidney and thymus are shown. Scale bars, 200 μm (top) and 100 μm (bottom). (D) Flow cytometry analysis of adult CD79b-GFP × Rag2-mCherry zebrafish kidney and thymus. Dotted region is GFP−mCherry−. Frequency of CD79b:GFP+ cells in kidney is 26.4%, in thymus is 5%. Data are representative of five separate CD79b/Rag2 transgenic fish kidney analyses. |
| Genes: | |
|---|---|
| Fish: | |
| Anatomical Terms: | |
| Stage: | Adult |