
Fig. 3
- ID
- ZDB-FIG-170922-39
- Publication
- Liu et al., 2017 - Zebrafish B Cell Development without a Pre-B Cell Stage, Revealed by CD79 Fluorescence Reporter Transgenes
- Other Figures
- All Figure Page
- Back to All Figure Page
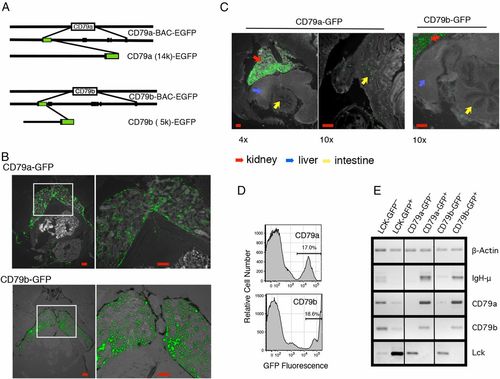
GFP expression in CD79a and CD79b transgenic zebrafish identify B cells. (A) Diagram of production of transgenic constructs, made by long PCR from BACs containing CD79a and CD79b, where the first coding exon of each was replaced by an EGFP-PolyA segment. (B) Low power (left panels) and higher power (right panels) images of GFP expression in thin sections of kidney region of adult (4–6 mo) CD79a-GFP and CD79b-GFP zebrafish. Images were processed with Nuance software to reduce background autofluorescence. Scale bars, 100 μm (left), 200 μm (right). (C) Presence of CD79a:GFP+ and CD79b:GFP+ cells outside head kidney in adult fish. CD79a-GFP, ×4 cryosection. Scale bar, 100 μm (left), and original magnification ×10 image of cryosection. Scale bar, 200 μm (right). CD79a-GFP transgenic zebrafish also showing intestinal region. Scale bar, 200 μm. (D) Flow cytometry histogram plots of kidney marrow tissue from CD79a-GFP and CD79b-GFP lines. (E) GFP− and GFP+ cell fractions were purified by electronic cell sorting from Lck-GFP, CD79a-GFP, and CD79b-GFP kidney tissue. Figure shows ethidium bromide staining of DNA amplified by RT-PCR from these samples. The lines indicate where parts of the image were joined. |
| Gene: | |
|---|---|
| Fish: | |
| Anatomical Terms: | |
| Stage: | Adult |