
Fig. 2
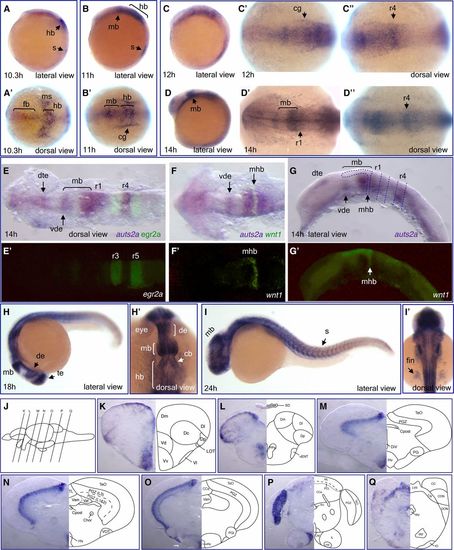
Expression of auts2a mRNA during zebrafish development. Whole-mount in situ hybridization analysis of auts2a-i3 transcript expression in wild-type embryos at different developmental stages: 10.3 hr (A and A’), 11 hr (B and B’), 12 hr (C–C''), 14 hr (D–D''), 18 hr (H and H'), and 24 hr (I and I'). (E–G') Double in situ hybridization with egr2a (krox20) (E and E’) and wnt1 (F' and G’) as second probes. In (G), dotted lines approximately demarcate rhombomere borders and midbrain. (K–Q) Transverse sections at the levels indicated by the vertical lines in (J) show auts2a-i3 mRNA expression in different regions of the juvenile brain: telencephalon (K and L), diencephalon and midbrain (M–O), and hindbrain (P and Q). Abbreviations used to label areas in brain sections can be found in Table S1. cb, cerebellum; cg, cranial ganglia; de, diencephalon; dte, dorsal telencephalon; fb, forebrain; hb, hindbrain; mb, midbrain; mhb, midbrain-hindbrain boundary; ms, mesoderm; r, rhombomere; s, somite; te, telencephalon; vde, ventral diencephalon. |