
Fig. 6
- ID
- ZDB-FIG-170908-7
- Publication
- Delile et al., 2017 - A cell-based computational model of early embryogenesis coupling mechanical behaviour and gene regulation
- Other Figures
- All Figure Page
- Back to All Figure Page
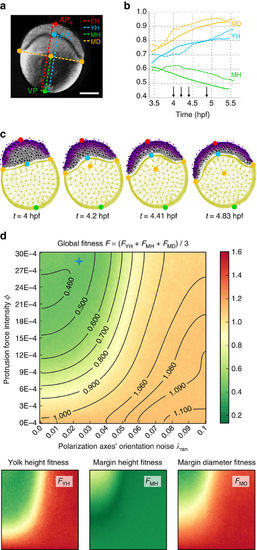
Parameter exploration of the zebrafish epiboly study. See Fig. 5. (a) Macroscopic measurements of the epibolic deformation (pasted on a Nomarski 2D picture at the level of the sagittal plane by Karlstrom and Kane45, with permission). Landmarks: vegetal pole (VP), animal pole (APe), yolk animal pole (APy). Distances: embryo height (EH), yolk height (YH), margin height (MH) and margin diameter (MD). Scale bar 200 μm. (b) Temporal evolution of the last three measurements normalized by EH in the live embryo (dashed lines) and the best simulated embryo (solid lines). (c) Snapshots at four intermediate stages (time arrows in b). As deep cells divide (mitosis equations (24)–(29) based on empirical data29,32), their number increases to 3,095. See parameters in Supplementary Table 4. (d) Fitness landscapes as a function of the protrusive force intensity ϕ and a noise factor λran controlling the regularity of the polarization axes’ orientation. The global fitness function F is the average of the yolk height fitness FYH, the margin height fitness FMH and the margin diameter fitness FMD. A lower fitness value (green) means a better similarity with the live embryo. The blue cross highlights the parameter values used in b, which are: |
 ≈ (0.025, 28.5E-04).