
Fig. 5
- ID
- ZDB-FIG-170908-6
- Publication
- Delile et al., 2017 - A cell-based computational model of early embryogenesis coupling mechanical behaviour and gene regulation
- Other Figures
- All Figure Page
- Back to All Figure Page
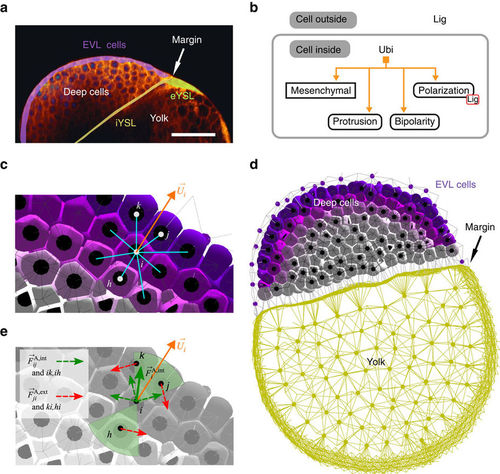
,p>Example of collective behaviour during the zebrafish epiboly. See Supplementary Movie 3. (a) 2D section from live imaging 3D data (‘oblong’ stage, 3.7 hpf), highlighting the EVL, the external and internal YSL, and the interface between the blastoderm and the yolk cell (credit: BioEmergences). Scale bar 150 μm. (b) Simplified GRN controlling the bipolar protrusion of mesenchymal deep cells via protein Ubi, oriented by a gradient of extracellular ligand Lig. (c) Their polarization axes |
 are oriented by chemotaxis (Supplementary Note 3, equations (43)–(46)) along a radial gradient of ligand (purple) released from the EVL (not shown). (d) Sagittal section of the whole simulated embryo (4 hpf), containing 1,595 deep cells (purple and grey polyhedra) and showing the EVL cell centres (purple dots), yolk particles (yellow dots) and yolk membrane (peripheral yellow edges). EVL and yolk take part only in passive relaxation forces. (e) In the bipolar domain of cell i (green cones) containing three neighbours, protrusive forces comprise ‘intrinsic’ (dashed green arrows) and ‘extrinsic’ components (dashed red; equation (21) and Supplementary Fig. 9), resulting in
  (solid green arrow).