
Fig. S8
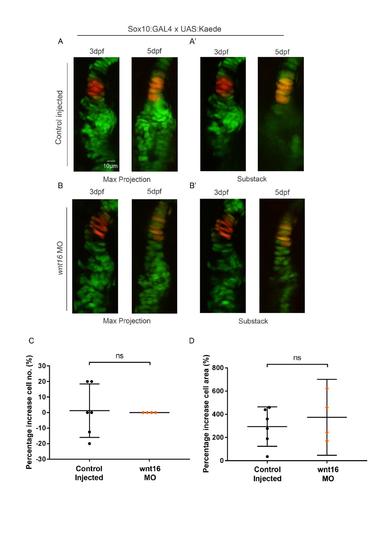
Cell proliferation and migration in intercalating cells of the Meckel’s cartilage are not affected by Wnt16 morpholino knockdown. (A-B'): Tg(Sox10:GAL4-VP16) and Tg(UAS:Kaede) transgenic line drives expression of kaede protein (green) in cartilage of control injected (A) and Wnt16 MO injected (B) zebrafish. Maximum projections of the jaw joint from stacks of tiff images (A,B) and single slice/substacks through the same jaw joint to show cell morphology (A',B') are represented. Kaede expressing cells located in the mid region of the MC are photoconverted to red kaede at 3dpf (left panels). MC of the same fish is then reimaged at 5dpf (right panels). Photoconverted cells appear red/orange due to presence of photoconverted red kaede and new expression of green kaede protein. (C): Percentage increase in number of cells expressing photoconverted red kaede between 3 and 5dpf in control injected and Wnt16 MO injected zebrafish MC elements. (n=6, 4 animals). (D): Percentage increase in total area of cells expressing photoconverted red kaede between 3 and 5dpf in control injected and Wnt16 MO injected zebrafish. (n=6, 4 animals). Two-tailed student t-tests were performed (B,C). ns= not significant. Bars on graph represent mean and 95%CI. |