
Fig. 6
- ID
- ZDB-FIG-170829-22
- Publication
- Förster et al., 2017 - An optogenetic toolbox for unbiased discovery of functionally connected cells in neural circuits
- Other Figures
- All Figure Page
- Back to All Figure Page
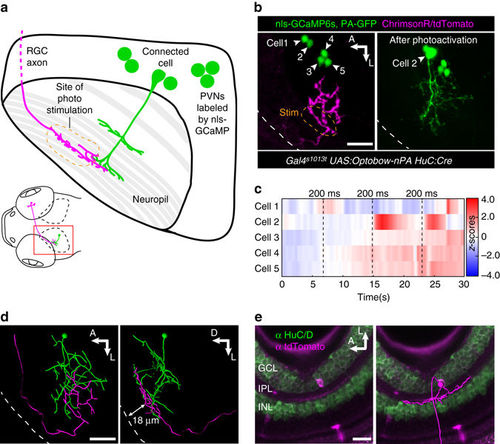
Optobow analysis can be expanded to study long-range connectivity of different cell types. a Sketch simplifying the connection of an RGC axon with a PVN in the optic tectum. b Live expression of Optobow-nPA. A single RGC axon (magenta) and five PVN nuclei are labeled (green, left). White dashed lines mark the skin. Upon identification of the connected cell#2, PA-GFP was photoactivated (right). Scale bar, 20 µm. c Calcium traces (Z-scores) for the cells annotated in b. Photostimulation epochs of 200 ms are indicated by dashed lines. Only cell#2 showed responses upon photostimulation. d Filament reconstructions in dorsal view (left) and transverse view (right). The RGC axon terminates in the stratum fibrosum et griseum superficiale (SFGS) layer 1 (18–20 µm distance from skin), where it contacts the dendrites of the bistratified PVIN (cell#2). Scale bar, 20 µm. e Immunostainings against HuC/D (green) and tdTomato (magenta) reveal the dendritic pattern of the activated RGC in the retina. A filament reconstruction is shown on the right. Its monostratified dendrites exclusively target the OFF layer of the IPL. Scale bar, 20 µm. GCL, ganglion cell layer; INL, inner nuclear layer; IPL, inner plexiform layer; PVIN, periventricular interneuron |