
Fig. S6
- ID
- ZDB-FIG-170809-20
- Publication
- Di Gioia et al., 2017 - A defect in myoblast fusion underlies Carey-Fineman-Ziter syndrome
- Other Figures
- All Figure Page
- Back to All Figure Page
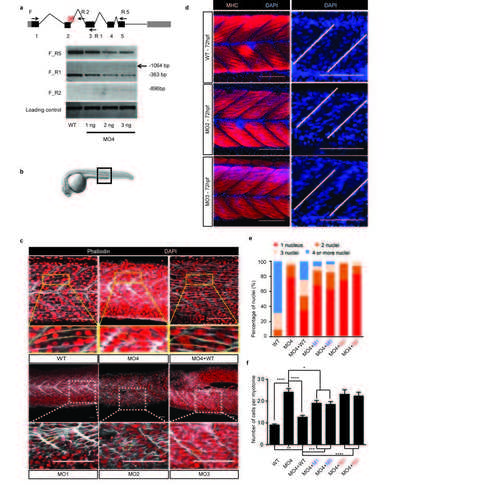
Morpholinomediated knockdown of mymk in zebrafish leads to incomplete myoblast fusion that is partially rescued by co-injection of WT or hypomorphic-mutant MYMK mRNA, but not rescued with null-mutant MYMK mRNA. (a) Splice-blocking morpholino MO4 causes aberrant retention of intron 2 in the zebrafish mymk transcript. Top: Schematic representation of mymk transcript. Grey boxes indicate the 5’ and 3’ UTRs, black boxes indicate exons, and connecting lines indicate introns. A red cross indicates the MO4 binding site. Arrows denote the position of forward (F) and reverse (R1, R2, and R5) primers used to amplify the WT and aberrant transcripts by RT-PCR. Bottom: RT-PCR products following amplification of mymk transcript with F+R5 (top), F+R1 (second row), F+R2 (third row) from cDNA of WT zebrafish and zebrafish treated with 1ng, 2ng, and 3ng of MO4. Note the appearance of the F_R2 band with increasing doses of MO4, reflecting failure to splice intron 2 out of the transcript. Note also the appearance of the 1064 bp band following amplification of F_R1 in the presence of 3ng MO4, reflecting the larger transcript. Finally, the amount of WT F-R5 and F-R1 product falls with increasing MO4, likely reflecting nonsense mediated decay. Amplification of mafa is provided as a control (bottom). (b) Brightfield picture of a zebrafish larva at 24 hpf. The black box indicates the area around somite X depicted in (d). (c) Lateral view at 24 hpf of control, MO1-MO4 morpholinos, and MO4 morpholino+WT mRNA injected zebrafish embryos showing the medial region of the myotome surrounding somite ten (X) as boxed in (b). Membranes of fast-twitch myoblasts are stained grey-white using fluorescently conjugated phalloidin; nuclei are stained red with DAPI. Boxed regions are shown in higher magnification below with yellow dotted lines outlining a single myofiber. WT fish have fully fused myofibers each containing up to 4 nuclei. Morpholino-treated embryos have normal appearing myotomal organization but have many single (unfused), two, and three nuclei myofibers. Co-injection of MO4 with 100 pg of human WT mRNA partially rescues the multinucleated phenotype. Scale bars: top images 50 μm, inset 100 μm. (d) Lateral view of AB zebrafish embryos at 72 hpf showing differentiated myofibers stained with F310 anti-fast-myosin heavy chain antibody (red) and DAPI (blue). WT embryos have well-organized myofibers aligned tightly parallel to one another and the nuclei show no clear preferential position within the myotome. By contrast, the myofibers in mymk morpholino-injected embryos are less well aligned, and nuclei cluster toward the center of the myotome, parallel to the myosepta (transverse white lines). Scale bars 100 μm. (e) Number of nuclei present in each myofiber within a single myotome adjacent to somite X in WT and MO4 morpholino-treated embryos, and in embryos co-injected with MO4 and human WT or mutant mRNA, reveal a consistent partial rescue with human WT mRNA, less rescue with the two hypomorphic alleles, and no rescue with the two null alleles. Results are normalized to total number of cells present within each myotome. (f) Quantification of the number of cells defined by phalloidin-stained membranes within a 2500 μm2 area of a single myotome adjacent to somite X. P values were calculated by two-tailed Student’s t test. N’s for (e and f) as follows: WT ntotal=10 (n per injection: 3/2/1/1/1/2); MO4 ntotal=10 (1/4/5); MO4+WT ntotal =10 (1/4/5); MO4+P91T ntotal =9 (5/4); MO4+I154T ntotal =8 (2/6); MO4+G100S ntotal=6 (3/3); MO4+C185R ntotal =6 (3/3). Within an experimental condition, each injection was on a separate day. Figure d upper panel scale bars 50 μm, inset scale bars 10 μm. Figure c lower panel scale bars 50 μm, inset scale bars 100 μm. Figure d scale bars 100 μm. See also Supplementary Table 2. |
| Fish: | |
|---|---|
| Knockdown Reagents: | |
| Observed In: | |
| Stage Range: | Prim-5 to Protruding-mouth |