
Fig. 5
- ID
- ZDB-FIG-170809-19
- Publication
- Di Gioia et al., 2017 - A defect in myoblast fusion underlies Carey-Fineman-Ziter syndrome
- Other Figures
- All Figure Page
- Back to All Figure Page
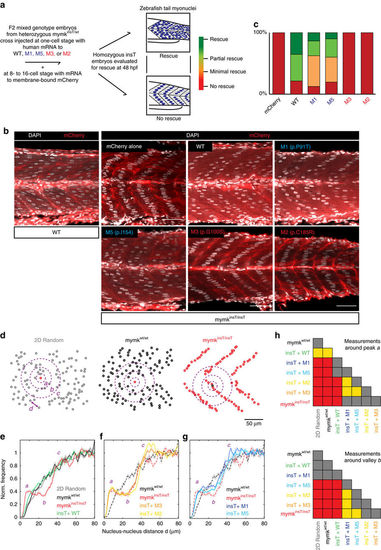
Ectopic expression of MYMK-WT and -hypomorphic alleles can fully or partially rescue the mymkinsT/insT fusion phenotype. (a) Approach to evaluate rescue of mymkinsT/insT 48 h.p.f. embryo fusion phenotype following co-injection of WT or mutant human MYMK mRNA. Nuclear dispersion is qualitatively stated to be low (no rescue), minimal (slight rescue), moderate (partial rescue), or high (rescue). (b) Optical sections of laterally mounted 48 hpf mymkwt/wt embryo injected with mCherry, and six mymkinsT/insT embryos injected as per a. WT-, M1-, M5-MYMK mRNA injected embryos show partial rescue. M2-, M3-, and mCherry alone do not. Red: membrane bound mCherry. White: DAPI. Scale bar=50 μm. (c) Qualitative analysis of nuclear organization of embryos in b according to colour key in a. (d) Digitized images of the distribution of randomly generated non-overlapping xy positions (left), mymkwt/wt myonuclei (middle), mymkinsT/insT myonuclei (right); left-right arrow d denotes distance between two nuclei; circles a, b, c are ~10, 25, 50 μm from center nucleus, respectively. (e) Frequency of distances from each nucleus to all others. 2D random (grey), mymkwt/wt (black) and mymkinsT/insT+WT mRNA (green) have the same trend, while mymkinsT/insT (red) exhibits differences at distances a, b, c (circles in d). Increased frequency at distance a reflects the increased number of near neighbors. Decreased frequency at distance b reflects the lack of nuclei between the rows of aligned nuclei in mymkinsT/insT embryos. (f) mymkinsT/insT embryos injected with mutant MYMK mRNA M2 (yellow) or M3 (orange) have normalized frequencies most similar to mymkinsT/insT (red dashed line) versus mymkwt/wt (black dashed line), consistent with lack of rescue. (g) mymkinsT/insT embryos injected with mutant MYMK mRNA M5 (turquoise) or M1 (blue) have normalized frequencies that fall between mymkinsT/insT (red dashed line) versus mymkwt/wt (black dashed line), consistent with partial rescue. Shaded bands=±SEM. (h) Two sample analyses for statistical significance (Kolmogorov-Smirnov) between couples of distributions in regions a, b. Top: Statistics for nuclei that fall in a distance range of 5 μm<d<10 μm (circle a). Bottom: Statistics for nuclei that fall in a distance range of 18 μm<d<28 μm (circle b). Grey box: NS (PKS>0.05); Yellow box: *0.01<PKS<0.05; Red box: **PKS<0.01. See also Supplementary Figs 6,7. |