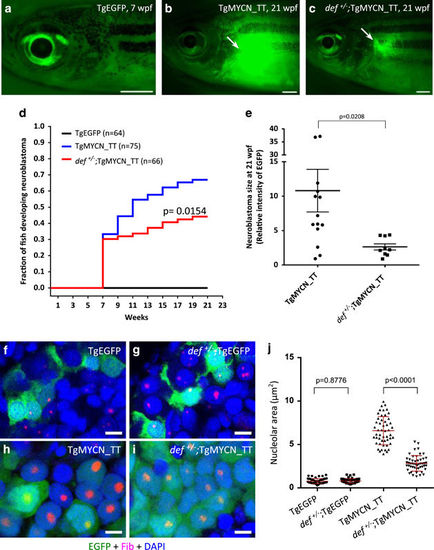
def haploinsufficiency decreases the penetrance and inhibits the growth of tumors in the TgMYCN_TT neuroblastoma model. (a–c) In TgMYCN_TT transgenic line with wild-type def (TgMYCN_TT) (b) or def+/− (def+/−;TgMYCN_TT) (c) background, EGFP expressed in the tumor (arrows) arose in the IRG at 21 wpf. TgEGFP transgenic line (a) was used as negative control. Scale bar, 1 mm. (d) Cumulative frequency of neuroblastoma in stable transgenic lines analyzed by Kaplan–Meier method. The difference between tumor onset by 21 wpf for TgMYCN_TT and def+/−;TgMYCN_TT is significant at P=0.0154 by the log-rank test. (e) Tumor size in transgenic fish of different backgrounds (b and c) was calculated. Horizontal bars indicate the means±s.e.m., which were compared with the two-tailed unpaired Welch t-test, P=0.0208. (f–i) Coimmunostaining of EGFP and nucleolar marker Fib of the sagittal sections through IRG of TgEGFP (f) and def+/−;TgEGFP (g), and the tumor sections of TgMYCN_TT (h) and def+/−;TgMYCN_TT (i) transgenic lines at 7 wpf. Nuclei were stained with DAPI. Scale bar, 5 μm. (j) Nucleolar area indicated by nucleolar marker Fib in the sections of (f–i) was calculated. Horizontal bars indicate the means±s.e.m., which were compared with the two-tailed unpaired Welch t-test. wpf, weeks post fertilization.
|
