
Fig. 9
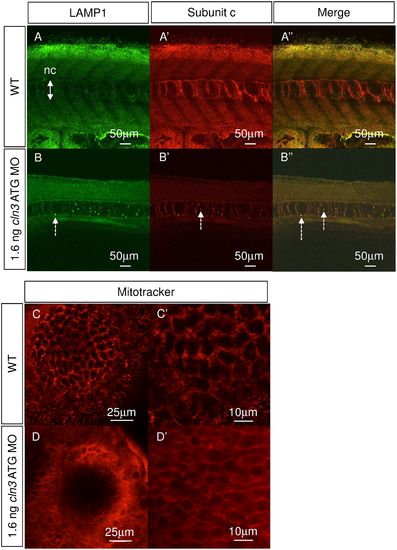
Subunit c accumulates in lysosomes, and mitochondria are compromised in cln3 ATG MO morphants. (A-A", B-B") Immunohistochemical staining for lysosomal associated membrane protein 1 (LAMP1, green) and subunit c of the mitochondrial ATP synthase (subunit c, red) at 4 dpf. (A-A'') WT. (B-B'') 1.6 ng cln3 ATG MO morphants. In morphants, lysosomes appear larger (B, dashed arrow), subunit c accumulates (B', dashed arrow) and they co-localise (B'', dashed arrows). Abbreviations: nc, notochord. Z slice. Lateral view. Anterior to left. Dorsal up. Scale bars: 50 μm. (C-C', D-D') Mitotracker stain labelling mitochondria in superficial cells of the eye at 4 dpf. (C-C') WT. (D-D') 1.6 ng cln3 ATG MO morphant. In WT cells, many individual mitochondria are observed, whereas in morphant cells the stain has not been accumulated by mitochondria suggesting loss of mitochondrial membrane potential. Z slice. Lateral view. Scale bars: C, D 25 μm; C', D' 10 μm. |
| Fish: | |
|---|---|
| Knockdown Reagent: | |
| Observed In: | |
| Stage: | Day 4 |