
Fig. 2
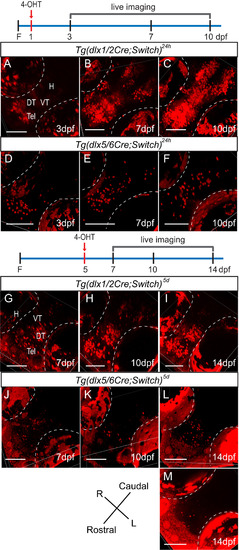
Lineage tracing of dlx1a/2a and dlx5a/6a expressing cells by live confocal imaging of double transgenic fish induced with 4-OHT. The diagrams illustrate induction with 4-OHT (red arrow) along the timeline and the days on which the fish were imaged as shown below. (A-C) Tg(dlx1/2Cre;Switch)24h embryos imaged at 3 dpf (A, n=11), 7 dpf (B, n=14) and 10 dpf (C, n=12). (D-F) Tg(dlx5/6Cre;Switch)24h embryos imaged at 3 dpf (D, n=13), 7 dpf (E, n=19) and 10 dpf (F, n=9). (G-I) Tg(dlx1/2Cre;Switch)5d embryos imaged at 7 dpf (G, n=8), 10 dpf (H, n=7) and 14 dpf (I, n=6). (J-M) Tg(dlx5/6Cre;Switch)5d embryos imaged at 7 dpf (J, n=9), 10 dpf (K, n=7), 14 dpf (L, M, n=6). Inductions were performed in at least three biological replicates. Auto-fluorescence of the pigment cells in the eyes is outlined in white dotted lines. All fish are oriented with the rostral end at the bottom left. Scale bar: 100 µm. |
Reprinted from Developmental Biology, 427(1), Solek, C.M., Feng, S., Perin, S., Weinschutz Mendes, H.C., Ekker, M., Lineage tracing of dlx1a/2a and dlx5a/6a expressing cells in the developing zebrafish brain, 131-147, Copyright (2017) with permission from Elsevier. Full text @ Dev. Biol.