
Fig. S3
- ID
- ZDB-FIG-170614-9
- Publication
- Krens et al., 2017 - Interstitial fluid osmolarity modulates the action of differential tissue surface tension in progenitor cell segregation during gastrulation
- Other Figures
- All Figure Page
- Back to All Figure Page
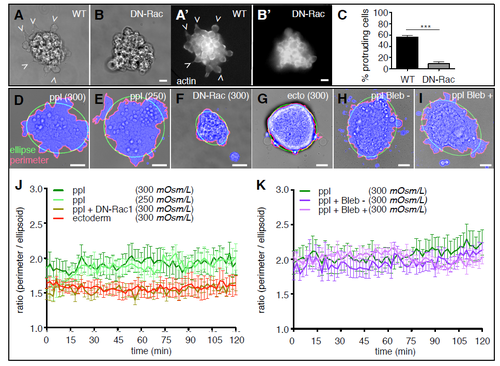
Protrusion formation in mesoderm (ppl) and ectoderm progenitor cells in vitro. (A,A',B,B') Bright-field (A,B) and fluorescence images (A',B') of WT (A,A') and DN-Rac expressing (B,B') Tg(βActin:Utrophin-mCherry) ppl progenitor cells plated on fibronectin-coated substrates for 1.5 h to monitor their protrusion formation in vitro. Scale bars, 10 μm. (C) Bar graph showing the percentage of protrusion forming ppl cells at the cell aggregate periphery. n (WT) = 14 and n (DN-Rac) = 15 experiments. Error bars are standard deviations; *** p < 0.01. (D-I) Bright-field images of WT ppl (D,E,H,I), DN-Rac expressing ppl (F) and ectoderm (G) progenitor cell clusters plated on fibronectin-coated substrates and cultured in 300 mOsm/L (D,F,G,H,I) or 250 mOsm/L (E), supplemented with either Blebbistatin - (H) or Blebbistatin + (I) to monitor their protrusion formation in vitro for 2 h. Scale bars, 20 μm. (J) Line graph showing the quantification of protrusive activity by plotting the calculated difference between the plated cell cluster perimeter (red lines in D-I) of the segmented cells clusters (blue area in D-I) and a fitted ellipsoid with the same area (red lines in D-I) over time. n (ppl, 300 mOsm/L) = 8, (ppl, 250 mOsm/L) = 4 , n (ppl + DNRac) = 8 , n (ectoderm) = 4 experiments. (K) Line graph showing the same quantification approach as in (J) for a separate experimental data set of ppl progenitor cell cluster cultured in 300 mOsm/L supplemented with blebbistatin isoforms, n (ppl) = 7 , n (ppl + Bleb-) = 6 , n (ppl + Bleb+) = 6 experiments. |