
Fig. 3
- ID
- ZDB-FIG-170609-38
- Publication
- Theodore et al., 2017 - Distinct Roles for Matrix Metalloproteinases 2 and 9 in Embryonic Hematopoietic Stem Cell Emergence, Migration, and Niche Colonization
- Other Figures
- All Figure Page
- Back to All Figure Page
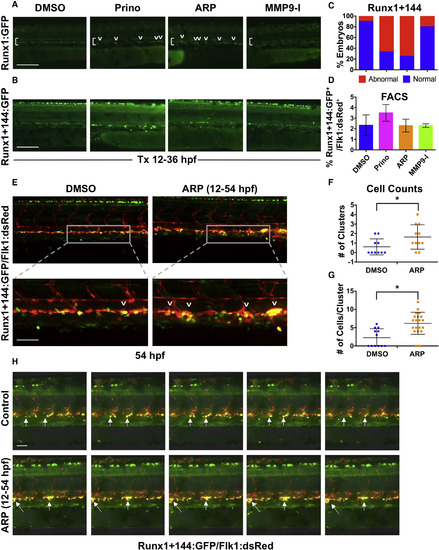
Mmp2 Inhibition Causes Abnormal HSPC Accumulation in the VDA (A) In vivo imaging for Runx1:GFP confirmed altered HSPC development in the VDA with Prinomastat (20 μM) and ARP (10 μM) (12–36 hpf; n ≥ 20 embryos/condition). (B) In vivo imaging for Runx1+144:GFP phenocopied effects seen in 3A. (C) Qualitative phenotypic distribution of embryos from (B) scored with normal or abnormal Runx1+144:GFP expression in the VDA at 36 hpf (n value as in A). (D) FACS analysis of Runx1+144:GFP+/Flk:dsRed+ HSPCs showed no significant difference with MMP inhibitor exposure (12–36 hpf; 5 embryos/sample, ≥3 replicates/condition). (E) Representative confocal images of Tg(runx1+23(144−378):egfp/kdrl:dsred) embryos, showing: (top) double-positive HSPC clusters in the VDA with ARP treatment (12–54 hpf) compared with control; (bottom) high magnification of a select cluster (n > 10 embryos/condition). (F) Absolute counts of Runx1+144+/Flk+ HSPC clusters (of >3 cells) in the VDA in embryos from (E) showed a significant increase in total clusters after ARP treatment (n > 10 embryos/condition; ∗p < 0.05). (G) Absolute counts of Runx1+144+/Flk1+ HSPC clusters (of >3 cells) in the VDA in embryos from (E) showed a significant increase in cells per cluster with ARP treatment (n > 10 embryos/condition; ∗p < 0.05). (H) Still images from the time-lapse analysis (2:45–3:10 min time stamp; see Movies S3 and S4) showed altered budding and egress of Runx1+144+Flk1+ HSPCs in the presence of ARP exposure (12–54 hpf; 2 replicates/condition) compared with controls. Arrows mark HSPC clusters; brackets mark dorsal/ventral boundaries of the VDA and CV. Error bars denote mean ± SD. Scale bars, 100 μm (A and B) and 50 μm (E and H). |
| Genes: | |
|---|---|
| Fish: | |
| Conditions: | |
| Anatomical Term: | |
| Stage Range: | Prim-25 to Long-pec |
| Fish: | |
|---|---|
| Conditions: | |
| Observed In: | |
| Stage Range: | Prim-25 to Long-pec |