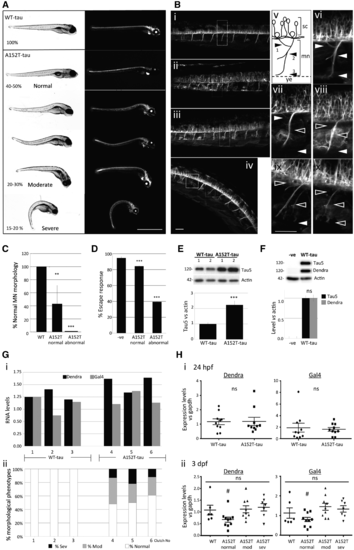
Phenotypic characterization of Dendra-tau transgenic zebrafish. (A) Representative images of fish with pan-neuronal expression of WT-tau and A152T-tau. In all clutches of WT-tau offspring, larvae were normal. In contrast, A152T-tau fish showed abnormal phenotypes in ∼50% of each clutch. Differing degrees of abnormal curvature of the dorsal spine was observed in A152T-tau fish (percentages refer to the number of the larvae within each severity range per clutch; observations based on more than 30 individual clutches per transgenic line). Scale bar = 1 mm. (B) Motor neuron morphology was analysed by confocal microscopy on live fish and abnormalities found only in A152T-tau fish including truncation, abnormal pathfinding and aberrant branching (ramifications) (i) WT-tau; (ii–iv) A152T-tau, with normal (ii), moderate (iii) and severe (iv) phenotypes. (v) Schematic view of a single somatic motor neuron (mn) unit from the spinal cord (sc) to the yolk extension (ye) and its ramifications divided into dorsal (arrowhead 1) and medial (arrowhead 2). Arrowhead 3 labels normal axonal length reaching the yolk extension. Panels vi–x correspond to magnified images of i–iv highlighting normal (white arrowheads) or abnormal (black arrowheads) ramifications and length according to axonal scheme represented in v [vi corresponds to WT-tau (i); vii corresponds to normal phenotype A152T-tau (ii); viii corresponds to moderate phenotype A152T-tau (iii); ix and x correspond to severe phenotype A152T-tau (iv)]. Scale bar = 50 µm. See also Supplementary Fig. 2. (C) Quantification of the branching defects observed in motor neurons (MN) according to scheme in B(v) at 3 dpf. Abnormalities at any specified point (arrowheads 1, 2 or 3) were counted as abnormal (five segmental motor neuron units within the yolk sac extension region of the trunk, anterior to the urogenic opening, were counted for n = 18 fish per group; graph represents mean ± SD; two-tailed t-test, **P < 0.01 and ***P < 0.001 versus WT-tau). (D) Escape response defects were observed in A152T-tau but not WT-tau fish at 6 dpf (three independent experiments in triplicate, n = 20/group shown as mean ± standard error; ***P < 0.001 versus negative siblings by two-tailed t-test). (E) Fish expressing A152T-tau show significantly higher levels of total human tau protein at 3 dpf (mean ± SEM, n = 3 independent clutches in triplicate, ***P < 0.001 versus WT-tau by two-tailed t-test). (F) Levels of Dendra-tau protein (∼120 kDa) could be equally detected by western blot with either Dendra or Tau5 antibodies (mean ± standard error of four clutches in triplicate, by two-tailed t-test). (G) The higher levels of Dendra-tau together with the morphological and motility defects observed in A152T-tau fish are not the result of higher levels of expression of the transgene (mRNA levels). [G(i)] Quantification of the mRNA expression levels of Dendra and Gal4 by quantitative RT-PCR at 24 hpf (pre-phenotype) shows variability in the expression of Dendra between different clutches of WT-tau fish (three independent clutches labelled 1–3) and A152T-tau fish (three independent clutches labelled 4–6). Analysis was performed on groups containing n = 10 fish. [G(ii)] Phenotypic assessment of larvae at 3.dpf from the same clutches analysed in [G(i)] shows abnormal phenotypes in all clutches of A152T-tau fish regardless of the expression level of Dendra-tau. The similar levels of expression of Dendra in clutches 2 (WT-tau) and 5 (A152T-tau) at 24 hpf resulted in abnormal phenotypes only in A152T-tau expressing fish (sev = severe, mod = moderate, according to morphological phenotype score presented in A). (H) Quantification of the mRNA expression levels of Dendra and Gal4 from 10 individual fish collected from clutches 2 (WT-tau) and 5 (A152T-tau). When siblings from these clutches were analysed as pooled samples, equal Dendra mRNA expression levels were observed at 24 hpf. When mRNA expression levels of Dendra or Gal4 were measured in single WT-tau and A152T-tau fish at 24 hpf (pre-phenotype), no significant differences were observed. [H(i)]. At 3 dpf [H(ii)] WT-tau and A152T-tau individual fish with moderate and severe phenotypes had equivalent levels of Dendra and Gal4 mRNA expression. However, A152T-tau fish which were morphologically normal were found to have significantly lower levels of Dendra mRNA expression [H(ii)].
|
