
Fig. 7
- ID
- ZDB-FIG-170321-18
- Publication
- Zhang et al., 2017 - Left Habenula Mediates Light-Preference Behavior in Zebrafish via an Asymmetrical Visual Pathway
- Other Figures
- All Figure Page
- Back to All Figure Page
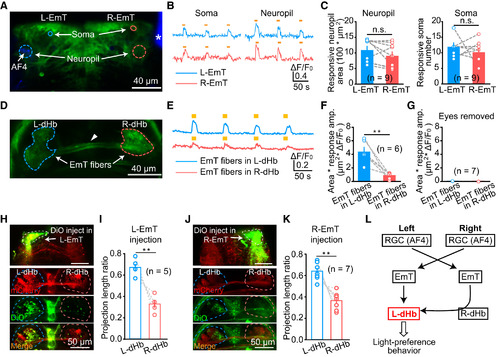
Asymmetrical Innervation from EmT to L-dHb (A) In vivo confocal imaging of the EmT in a 6-dpf Tg(Gal4s1020t,UAS:GCaMP5.0) larva. DiD was injected into the right eye (asterisk) and the left AF4 was visualized. Color circles represent somata or neuropil areas in the left EmT (L-EmT) and right EmT (R-EmT) for calculating visual responses. (B and C) Example traces (B) and summary (C) showing sustained excitatory calcium responses in both the soma and neuropil of the L-EmT (blue) and R-EmT (pink). In vivo calcium imaging was carried out from all the five layers of the EmT (10 μm per layer). 10 s flashes were applied. (E and F) Example traces (E) and summary (F) showing visual responses of EmT projection fibers in the L-dHb (blue) and R-dHb (red). 10 s flashes were used. Responses were calculated as the total responsive area multiplied by corresponding response amplitude (μm2 × ΔF/F0). (G) Visual responses of EmT projection fibers in the L-dHb (blue) and R-dHb (red) in 6-dpf Tg(Gal4s1020t,UAS:GCaMP5.0) larvae with bilateral eyes removed. (H and I) Sample images (H) and summary data (I) showing DiO-based anterograde tracing of L-EmT projections in both the L- and R-dHb. Left top in (H): EmT injection site; left bottom in (H): EmT projection fibers in the dHb. The length ratio of EmT projection fibers in either L-dHb or R-dHb to both sides of the dHb was calculated in (I). (J and K) Sample images (J) and summary data (K) showing DiO-based anterograde tracing of R-EmT projections in both the L- and R-dHb. (L) Working model showing that the AF4-projecting RGCs-EmT-L-dHb pathway mediates light-preference behavior. The number in the parentheses represents the number of larvae examined. Error bars, SEM n.s., not significant; ∗∗p < 0.01 (paired two-tailed Student’s t test). See also Figures S7 and S8. |