
FIGURE
Fig. 4
Fig. 4
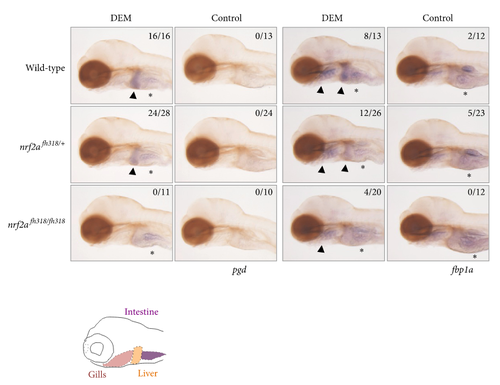
The induction profiles of glucose metabolism-related genes. Whole-mount in situ hybridization was performed to analyze the induction profile of pgd and fbp1a using 4 pdf nrf2afh318 mutant larvae treated with or without 100 μM DEM for 6 h. The arrowheads indicate positive expression in the liver and gills, and asterisks denote the basal expression in the intestine. The numbers in each picture indicate the positive expression in the liver/tested larvae. |
Expression Data
| Genes: | |
|---|---|
| Fish: | |
| Condition: | |
| Anatomical Terms: | |
| Stage: | Day 4 |
Expression Detail
Antibody Labeling
Phenotype Data
| Fish: | |
|---|---|
| Condition: | |
| Observed In: | |
| Stage: | Day 4 |
Phenotype Detail
Acknowledgments
This image is the copyrighted work of the attributed author or publisher, and
ZFIN has permission only to display this image to its users.
Additional permissions should be obtained from the applicable author or publisher of the image.
Full text @ Oxid Med Cell Longev