
Fig. 3
- ID
- ZDB-FIG-170222-34
- Publication
- Heanue et al., 2016 - A Novel Zebrafish ret Heterozygous Model of Hirschsprung Disease Identifies a Functional Role for mapk10 as a Modifier of Enteric Nervous System Phenotype Severity
- Other Figures
- All Figure Page
- Back to All Figure Page
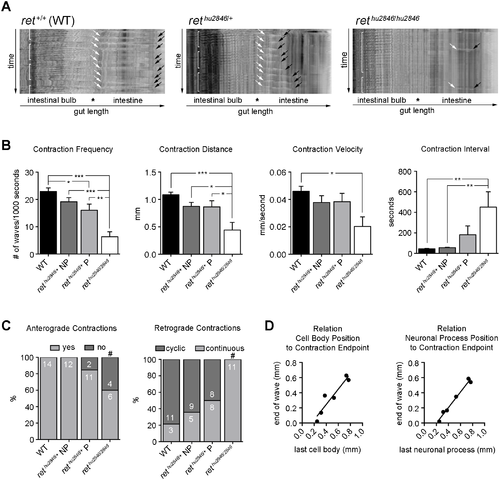
Intestinal motility is impaired in rethu2846/+ and rethu2846/2846 larvae. (A) Spatiotemporal maps (STMs) generated to quantify 400 second recordings of gut motility in live 7dpf zebrafish larvae. WT (ret+/+) larvae exhibit cyclical retrograde (anal to oral) motility patterns in the intestinal bulb (brackets), and anterograde (oral to anal) peristaltic waves in the intestine starting at the intestinal bulb/intestine junction (white arrows); black arrows denote motility end points. STMs of rethu2846/+ larvae with ENS phenotypes and rethu2846/2846 larvae show alterations in cyclical retrograde motility patterns (brackets) and frequency and distance of anterograde motility waves (white to black arrows). (B) Anterograde contraction characterization. Phenotypic (rethu2846/+P) and non-phenotypic (rethu2846/+NP) larvae identified immunohistochemically. Reduced peristaltic frequency in rethu2846/2846 larvae and rethu2846/+ P relative to WT (one-way ANOVA, p = 0.0004; Bonferroni’s post-hoc, p = 0.0001 and p = 0.0367), and also reduced in rethu2846/2846 larvae as compared to rethu2846/+ NP (p = 0.0002) and rethu2846/+ P (p = 0.0035). Reduced contraction travel distance in rethu2846/2846 larvae relative to WT (one-way ANOVA, p = 0.0005; Bonferroni’s post-hoc, p = 0.0002), and relative to both rethu2846/+ P (p = 0.0232) and rethu2846/+ NP (p = 0.0237). Reduced contraction velocity in rethu2846/2846 relative to WT (one-way ANOVA, p = 0.0212; Bonferroni’s post-hoc, p = 0.0138). Increased contractions interval in rethu2846/2846 larvae relative to WT and rethu2846/+ NP (one-way ANOVA, p = 0.0078; Bonferroni’s post-hoc, p = 0.0053 and p = 0.0097). (C) Loss of anterograde contractions in rethu2846/hu2846 larvae compared to WT and rethu2846/+ NP (#, Fisher’s exact, p = 0.0198 and p = 0.028). rethu2846/2846 larvae show retrograde motility changes relative to all other genotypes, with contractions losing cyclic patterns (Fisher’s exact, vs. WT: p = 0.0001, vs. rethu2846/+ NP: p = 0.001, and vs. rethu2846/+ P: p = 0.0082). (D) Equivalent analysis in the SAGFF234A;UAS:GFP background, expressing GFP in ENS cells and their processes, enables mapping of contraction endpoints relative to cell body position (GFP+HuC/D+ cells, rs = 0.8857, p = 0.0333) and cell process (GFP+HuC/D+ process, rs = 0.942, p = 0.0167). Black lines indicate linear fits. |
| Fish: | |
|---|---|
| Observed In: | |
| Stage: | Days 7-13 |