
Fig. 5
- ID
- ZDB-FIG-170208-13
- Publication
- Bielczyk-Maczyńska et al., 2015 - The Ribosome Biogenesis Protein Nol9 Is Essential for Definitive Hematopoiesis and Pancreas Morphogenesis in Zebrafish
- Other Figures
- All Figure Page
- Back to All Figure Page
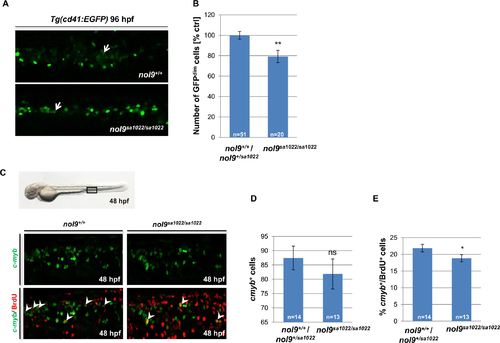
nol9sa1022/sa1022 mutants show a decrease in proliferation of c-myb+ cells. (A) Representative maximum projection confocal images showing HSPCs (GFPdim, arrow) in the CHT of Tg(cd41:EGFP) larvae at 96 hpf. Larvae are oriented with anterior to the left and dorsal to the top. (B) The number of GFPdim HSPCs observed in the CHT region of nol9sa1022/sa1022 mutants (n = 20) and their wt siblings (n = 51) at 96 hpf. Data are represented as the mean +/- SEM, Student’s t-test, **, p<0.01. (C) Representative confocal images of the CHT of Tg(cmyb:EGFP) embryos subjected to BrdU incorporation assay at 48 hpf. Arrowheads mark double positive BrdU+ c-myb+ cells. Bright field image of a 48 hpf embryo shows the imaged part of the CHT. (D) The total number of c-myb+ cells observed in the CHT of nol9sa1022/sa1022 embryos (n = 13) and their wt siblings (n = 14) subjected to the BrdU incorporation assay at 48 hpf. Data are represented as the mean +/- SEM. Student’s t-test. ns—not significant. (E) The percentage of BrdU+ cells within the c-myb+ population in the CHT of nol9sa1022/sa1022 embryos (n = 13) and their wt siblings (n = 14) subjected to the BrdU incorporation assay at 48 hpf. Data are represented as the mean +/- SEM, Student’s t-test, *, p<0.05. |
| Fish: | |
|---|---|
| Observed In: | |
| Stage Range: | Long-pec to Day 4 |