
Fig. 5
- ID
- ZDB-FIG-170130-18
- Publication
- Müller-Deile et al., 2016 - Overexpression of TGF-β Inducible microRNA-143 in Zebrafish Leads to Impairment of the Glomerular Filtration Barrier by Targeting Proteoglycans
- Other Figures
- All Figure Page
- Back to All Figure Page
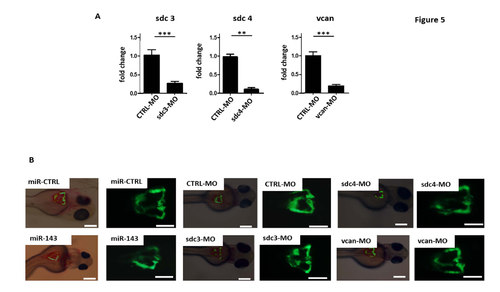
Quantification of target knockdown after versican and syndecan morpholino injection and fusion of zebrafish glomeruli at 48 hpf after versican and syndecan knockdown. (A) Q-PCR for relative sdc 3, 4 and vcan mRNA expression in whole zebrafish tissue at 120 hpf. Zebrafish were injected with syndecan 3 morpholino (sdc3-MO, 100 μM), syndecan 4 morpholino (sdc4-MO, 100 μM), versican morpholino (vcan- MO, 100 μM) or control morpholino (CTRL-MO, 100 μM) at one to four cell stage as indicated. Expression levels are compared to miR-CTRL and given as fold change. ** p<0.01, *** p<0.001. (B) Pictures illustrate glomerular fusion of transgenic zebrafish that expresses eGFP under the control of the wt1b promotor (wt1b:EGFP zebrafish) at 48 hpf. Zebrafish were injected with miR-143 mimic (miR-143, 5 μM) or miR control (miR-CTRL, 5 μM), syndecan 3 morpholino (sdc3-MO, 100 μM), syndecan 4 morpholino (sdc4-MO, 100 μM), versican morpholino (vcan-MO, 100 μM) or control morpholino (CTRL-MO, 100 μM) as indicated. Right pictures depicts glomerular fusion in fluorescent channel. Scale bar: 200 μm. Left pictures illustrates a merged picture of bright field and fluorescent channel. Scale bar: 200 μm. |
| Fish: | |
|---|---|
| Knockdown Reagents: | |
| Observed In: | |
| Stage: | Long-pec |