
Fig. 2
- ID
- ZDB-FIG-170117-11
- Publication
- Barbieri et al., 2016 - Nucleophosmin leukemogenic mutant activates Wnt signaling during zebrafish development
- Other Figures
- All Figure Page
- Back to All Figure Page
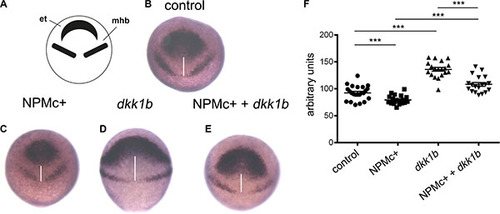
Analysis of CE movements at gastrulation. Whole mount in situ hybridization for rx3 and pax2a markers of the eye field and telencephalon region (et) and mid-hindbrain boundary (mhb), respectively. All embryos are at 90% epiboly, dorsal view. Distance between rx3 and pax2a expression regions was measured with ImageJ; statistical significance was assessed with a Student’t test. (A) Schematic representation of areas of markers expression. (B) Representative example of uninjected control. Embryos injected with: (C) NPMc+ mRNA; (D) dkk1b mRNA; (E) NPMc+ and dkk1b mRNAs. (F) Graphic representation of the distance between rx3 and pax2a expression regions for each measured sample (20 embryos were analyzed for each condition). |
| Genes: | |
|---|---|
| Fish: | |
| Anatomical Terms: | |
| Stage: | 90%-epiboly |