
Fig. 2
- ID
- ZDB-FIG-161101-6
- Publication
- Ito et al., 2013 - Close Association of Carbonic Anhydrase (CA2a and CA15a), Na(+)/H(+) Exchanger (Nhe3b), and Ammonia Transporter Rhcg1 in Zebrafish Ionocytes Responsible for Na(+) Uptake
- Other Figures
- All Figure Page
- Back to All Figure Page
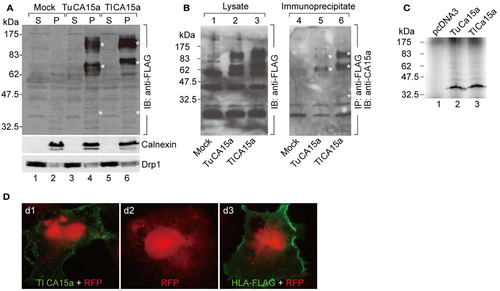
Cell surface expression of CA15a and specificity of anti-CA15a. (A) Membrane localization and oligomeric nature of zebrafish CA15a synthesized in cultured cells. 293T cells were transfected with mock, TuCA15-FLAG, or TlCA15-FLAG (Tu for Tuebingen wildtype line and Tl for Tupfel long fin wildtype line, which exhibited a slight variation in their amino acid sequences as mentioned in Section “Materials and Methods”. Two days after transfection, the cells were fractionated into the cytosol (S) and membrane pellets (P). The fractions (25 ¼g of proteins) were analyzed by Western blotting with antibodies against FLAG (top panel), calnexin (an ER membrane marker protein; middle panel), and Drp1 (a member of the dynamin family of large GTPases; bottom panel). (B) Antibody specificity. 293T cells were transiently transfected with mock (lanes 1 and 4), TuCA15-FLAG (lanes 2 and 5), or TlCA15-FLAG (lanes 3 and 6). Cells were homogenized in lysis buffer containing 1 M urea and 1 mM dithiothreitol (see Materials and Methods). The lysates were subjected to immunoprecipitation with anti-FLAG antibody beads followed by Western blotting with anti-CA15a antibody (lanes 4-6). The lysates (40 ¼g of proteins) were also analyzed by Western blotting with anti-FLAG antibody (lanes 1-3). Asterisks indicate the bands corresponding to monomer, dimer, and tetramer of CA15-FLAG. (C) TuCA15-FLAG (lane 2) and TlCA15-FLAG (lane 3) were translated in vitro in the presence of [35S]methionine and [35S]cysteine, and were then analyzed by SDS-PAGE followed by autoradiography. (D) Cell surface expression of CA15a demonstrated by immunofluorescence. COS7 cells were transfected with red fluorescent protein (RFP, red) alone (d2) or along with either TlCA15-FLAG (d1) or HLA-FLAG (d3). Non-permeabilized cells were analyzed by immunofluorescence microscopy with anti-FLAG antibody (green). HLA (human leukocyte antigen) or MHC (major histocompatibility complex) is a cell surface molecule. |