
Fig. 7
- ID
- ZDB-FIG-160927-35
- Publication
- Liu et al., 2016 - Fscn1 is required for the trafficking of TGF-β family type I receptors during endoderm formation
- Other Figures
- All Figure Page
- Back to All Figure Page
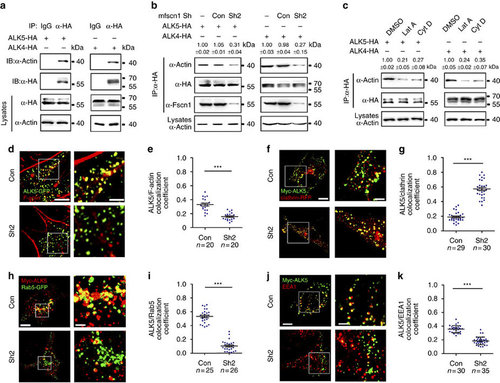
Downregulation of Fscn1 sequesters the internalized receptors in clathrin-coated vesicles. (a) Actin interacts with TGF-β family type I receptors. NMuMG cells were transfected with 8 µg indicated constructs per 100 mm dish, and then subjected to immunoprecipitation. (b) Fscn1 mediates the interaction of actin with TGF-β family type I receptors. Note that Fscn1-deletion markedly decreased the association of actin and ALK5 or ALK4. (c) NMuMG cells expressing HA-tagged ALK5 or ALK4 were treated with 1 µM Lat A or 2 µM Cyt D for 3 h, then collected for immunoprecipitation. In b and c, quantification is the mean relative ratio of co-immunoprecipitated signal over lysate (mean±s.d., three independent biological repeats). (d,e) NIH3T3 cells cotransfected with indicated plasmids were fixed and costained with phalloidin-TRITC and anti-GFP antibody to show the co-localization of F-actin (red) and ALK5 (green). The right images (Scale bar, 2 µm) were amplified from the boxed areas in the corresponding left images (Scale bar, 5 µm) (d). Peason’s co-localization coefficient was quantified from the indicated cell numbers in three independent experiments and the group values are expressed as mean±s.d. Student’s t-test, ***P<0.001 (e). (f-i) NIH3T3 cells were transfected with indicated plasmids and then subjected to antibody-labelled receptor endocytosis. Scale bar, (f) left images, 5 µm; right images, 2 µm. Scale bar, (h) left images, 5 µm; right images, 1 µm. Peason’s co-localization coefficient was quantified from the indicated cell numbers in three independent experiments and the group values are expressed as mean±s.d. Student’s t test, ***P<0.001 (g,i). (j,k) NIH3T3 cells expressing Myc-ALK5 and the indicated shRNAs were subjected to antibody-labelled receptor endocytosis. Scale bar,: left images, 5 µm; right images, 2 µm. Peason’s co-localization coefficient was quantified from the indicated cell numbers in three independent experiments and the group values are expressed as mean±s.d. Student’s t-test, ***P<0.001 (k). In the co-localization analysis, NIH3T3 cells were cultured in six-well plates. The dose of transfected plasmid DNA: ALK5-GFP, 0.5 µg; Myc-ALK5, 1 µg; shRNA2, 2 µg; Clathrin-RFP, 0.5 µg; Rab5-GFP, 0.5 µg. |