
FIGURE
Fig. 3
- ID
- ZDB-FIG-160927-3
- Publication
- Turcotte et al., 2016 - Intravital assessment of myelin molecular order with polarimetric multiphoton microscopy
- Other Figures
- All Figure Page
- Back to All Figure Page
Fig. 3
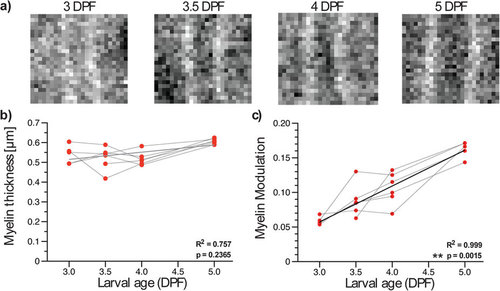
Developmental myelination of the Mauthner axon in live nacre zebrafish. (a) CARS images of the Mauthner axon on different days (image width: 8.4 µm). Representative images were selected from longitudinal imaging experiments (repeated imaging over time of same fish). (b) The myelin thickness and (c) the MM are plotted as a function of larval age. A steady increase in MM, but not in myelin thickness, was measured between 3 and 5 dpf. R2 for linear regression and p-value for non-zero slope test are given in each graph. |
Expression Data
Expression Detail
Antibody Labeling
Phenotype Data
Phenotype Detail
Acknowledgments
This image is the copyrighted work of the attributed author or publisher, and
ZFIN has permission only to display this image to its users.
Additional permissions should be obtained from the applicable author or publisher of the image.
Full text @ Sci. Rep.