
Fig. S7
- ID
- ZDB-FIG-160916-13
- Publication
- Shibata et al., 2016 - Fgf signalling controls diverse aspects of fin regeneration
- Other Figures
- All Figure Page
- Back to All Figure Page
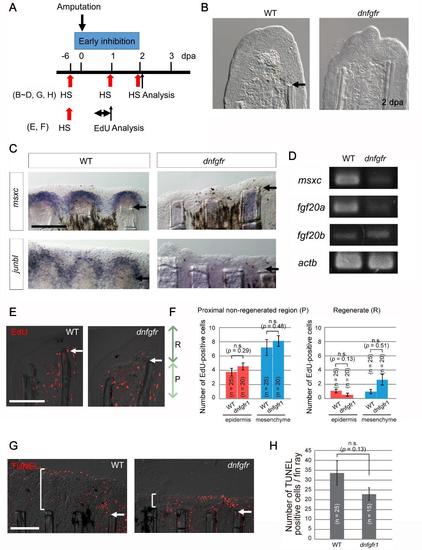
Early inhibition of Fgf signalling impairs blastema formation. (A) The experimental procedure for inhibition of the early Fgf signalling in the Tg(hsp70l:dnfgfr1). (B) Bright-field images of tissue sections of wild-type (WT) and Fgf-inhibited (dnfgfr) fins at 1 dpa. n = 5 of 5, respectively. No blastema formation was evident in the Fgf-inhibited fins. Scale bar, 50 µm. (C) Whole-mount ISH analysis of the blastema markers, msxc and junbl, in WT and Fgf-inhibited fins at 2 dpa. In the Fgf-inhibited fins, the blastema markers failed to be induced. n = 5 of 5 (msxc) and 9 of 9 (junbl). Scale bar, 200 µm. (D) RT-PCR analyses of the expression of msxc, fgf20a, and fgf20b in WT and Fgf-inhibited fins at 2 dpa. After the inhibition of early Fgf signalling, epidermal fgf20a and blastemal msxc were down-regulated, whereas the expression of fgf20b remained stable. The number of PCR cycles was 35. actb, β-actin1. (E) The effect of inhibition of Fgf signalling on cell proliferation at 1 dpa according to an assay of EdU incorporation. EdU labelling was done for 6 hrs before sampling. “R” indicates the regenerate distal to amputation plane, and “P” indicates the non-regenerated region within 100 µm proximal to the amputation plane. Scale bar, 100 µm. (F) Quantification of the EdU-positive cells shown in (E). As in Fig. S1, the 3rd - 5th fin rays from the dorsal or ventral side were used for quantification. n, the total number of sections used for scoring. Four wild-type (WT) and Tg (dnfgfr1) fish were used (5 sections from each fish). No significant difference was observed in the EdU incorporation at 1 dpa by the inhibition of Fgf signalling. Data are presented as mean ± s.e.m. Student’s t test was performed to evaluate statistical significance. n.s., not significant. (G) The effect of inhibition of Fgf signalling on apoptosis. Cellular apoptosis was detected at 2 dpa by the TUNEL staining. Brackets, the region in which the TUNEL-positive cells were counted. (H) Quantification of the number of TUNEL-positive cells per fin ray including the inter-ray region. No significant increase of apoptosis was detected by the inhibition of Fgf signalling. n, the number of fin rays used for quantification, which were derived from 5 WT and 4 dnfgfr1 Tg fish, respectively. n.s., not significant. |