
Fig. 4
- ID
- ZDB-FIG-160914-29
- Publication
- Pantoja et al., 2016 - Neuromodulatory Regulation of Behavioral Individuality in Zebrafish
- Other Figures
- All Figure Page
- Back to All Figure Page
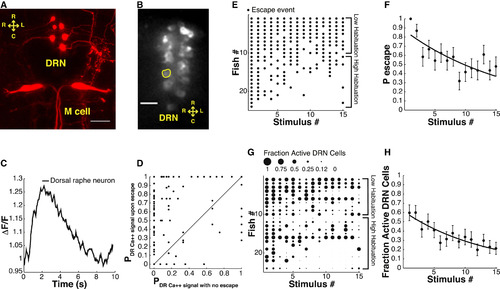
Simultaneous Analysis of ASR Behavior and Dorsal Raphe Nucleus Neuron Calcium Signals in 6 dpf Zebrafish Larvae (A) Image shows varicosities projecting from the dorsal raphe nucleus (DRN) toward the Mauthner cell dendrites (maximum projection of a z stack of confocal images, variegated individual shown for ease of demonstration). (B) Representative image of a confocal slice of DRN serotonergic neurons expressing GCaMP5. (C) Representative trace shows ROI normalized fluorescence in a single DRN neuron. (D) Probability of sound-evoked calcium responses for individual DRN neurons. Graph shows probability of sound-induced responses for individual cells during sound stimuli that did not induce escapes versus stimuli followed by escapes. (E) Acoustic startle responses of individual larvae ordered along y axis by probability of escape over the stimulus series. Each dot represents a sound-induced escape. (F) Significant decrease in ASR probability (F-statistic versus constant model: 23, p < 10-5, adjusted R-squared = 0.06). (G) Fractional activation of DRN neurons in individual larvae ordered in the y axis by probability of escape during stimulus series. The size of each dot is proportional to the number of cells activated by acoustic stimuli as a fraction of total number of analyzed individual neurons/fish. (H) Decrease in number of sound-activated DRN neurons as fraction of total number of analyzed individual neurons/fish during habituation (F-statistic versus constant model: 29.2, p < 10-6, adjusted R-squared = 0.073). Statistics: linear regression model analysis. 8-14 neurons/fish, nDRN neurons = 244, nlarvae = 24. Error bars, SEM. Scale bar, 25 µm. |